

USD/JPY Price Update: Consolidating Above Two-Month Low as on 17-07-2023
USD/JPY Analysis
Key Points
- Despite Friday's rebound from a two-month low, USD/JPY struggles to gain momentum due to a combination of factors.
- Speculation about the Bank of Japan (BoJ) making adjustments to its Yield Curve Control (YCC) policy strengthens the Japanese Yen (JPY) and limits the upside potential for the currency pair.
- Expectations that the Federal Reserve (Fed) is approaching the end of its cycle of interest rate hikes continue to exert downward pressure on the US Dollar (USD) and subsequently impact the USD/JPY pair.
Today's Scenario: -
The USD/JPY pair is facing challenges in capitalizing on Friday's modest rebound from the 137.25 level, which marked a nearly two-month low. As the new week begins, spot prices are trading within a narrow range in the Asian session, just above the mid-138.00s, awaiting a fresh catalyst before the next significant move in either direction.
Speculation that the Bank of Japan (BoJ) may adjust its Yield Curve Control (YCC) policy as early as this month is likely to support the Japanese Yen (JPY) and act as a headwind for the USD/JPY pair. These expectations were fueled by recent data revealing that Japan's nominal base salary recorded its fastest growth in 28 years in May. Japanese media reports have also suggested that the BoJ is likely to raise its inflation forecast for fiscal year 2023, as it has surpassed the 2% target for over a year. This may increase pressure on the central bank to begin unwinding its ultra-loose monetary policy settings. Consequently, the yield on the benchmark 10-year Japanese government bond reached its highest level since late April last week, providing additional support to the JPY.
Furthermore, a slightly softer sentiment observed in US equity futures is favoring the safe-haven JPY and contributing to limiting the upside potential for the USD/JPY pair. Coupled with the prevailing bearish sentiment surrounding the US Dollar (USD), this suggests that spot prices are more likely to decline. Investors are increasingly convinced that the Federal Reserve (Fed) is approaching the end of its cycle of interest rate hikes, particularly following the latest US Consumer Price Index (CPI) report, which indicated a further moderation in consumer prices. Additionally, the US Producer Price Index (PPI) recorded its smallest annual increase in nearly three years in June. These factors, along with signs of a cooling US labor market, should provide leeway for the US central bank to hold interest rates following the widely expected 25 basis points lift-off in July.
These developments have hindered the USD from capitalizing on its slight rebound from the lowest level since April 2022 observed on Friday, favoring the USD/JPY bears. Furthermore, technical indicators on the daily chart remain deeply in negative territory and have not yet reached oversold levels, confirming the bearish outlook for the near term. Consequently, any intraday positive moves in the pair may still be viewed as opportunities to sell and could dissipate quickly. Market participants are now turning their attention to a data release from China, which could influence broader market sentiment and provide some impetus for the USD/JPY pair. Later in the early North American session, traders will look to the release of the Empire State Manufacturing Index from the US for further guidance.
Diagram of USD/JPY: -

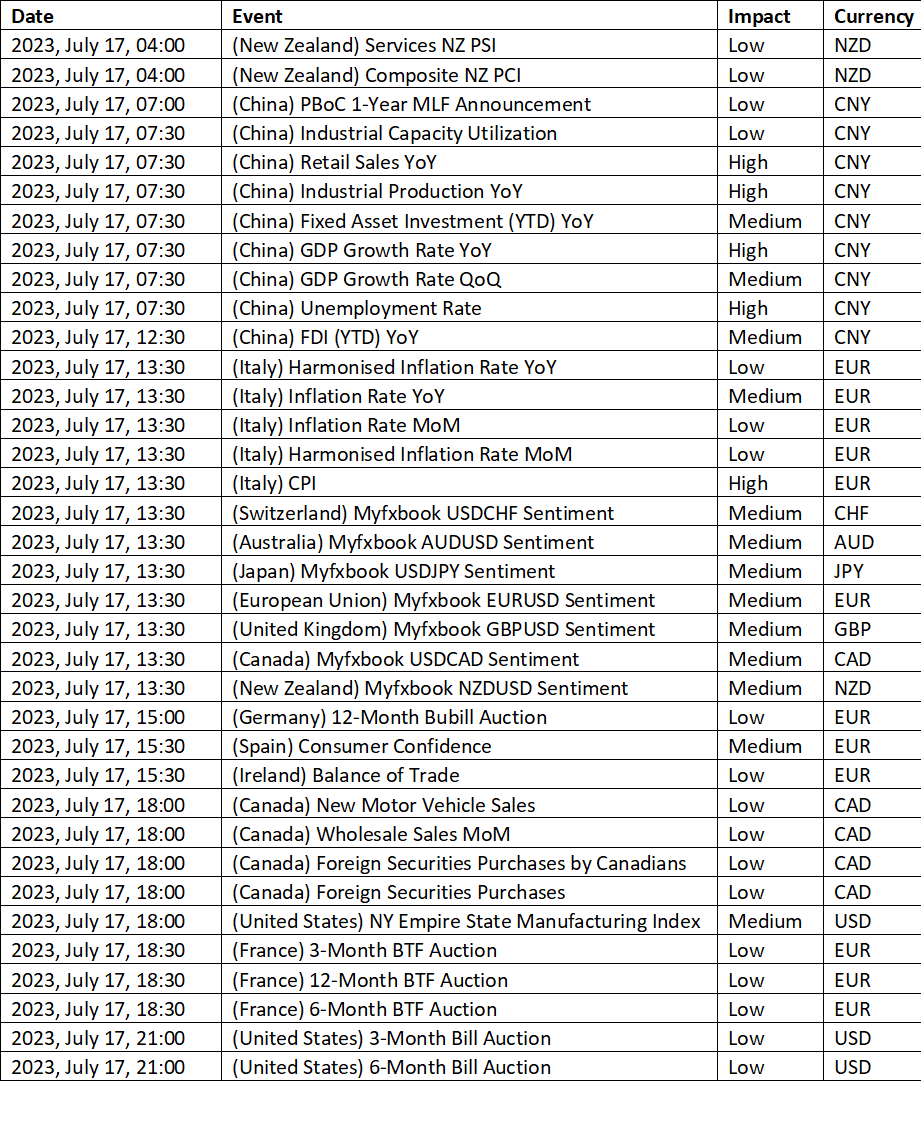
Economic Events: -
Buy Scenario: -
On the upside, a clear break above the resistance-turned-support line at approximately 139.35 should not be taken as a strong signal for USD/JPY bulls, as the round figure of 140.00 may act as an additional hurdle.
Overall, unless there is a successful breakout above the convergence of the 200-day Simple Moving Average (SMA) and the 23.6% Fibonacci retracement level, around 141.50, the
Till we did not advise to buy in USD/JPY.
Sell Scenario: -
On the downside, the pair may face some challenges, as the 50% Fibonacci retracement level of the upswing from late March to June, near 137.40, could provide support. Additionally, bullish signals from the Moving Average Convergence Divergence (MACD) indicator and an oversold reading on the 14-day Relative Strength Index (RSI) may also contribute to limiting further declines.
It's important to note that the peak reached in early May, around 137.80, could serve as an immediate support level for USD/JPY bears to monitor. However, if the pair convincingly breaks below 137.40, it could become vulnerable to further decline towards the 61.8% Fibonacci retracement level, located around 135.50.
Till we did not advise to sell the position in USD/JPY.
Support and Resistance Level: -
Support Resistance
S1 137.65 - R1 139.57
S2 136.49 - R2 140.33
S3 135.73 - R3 141.49


Discussion