

USD/JPY Price Forecasting: Consolidation near 139.00 Resistance - 19-07-2023.
USD/JPY Analysis
Key Points: -
- On Wednesday, the USD/JPY pair shows a slight upward movement, although the uptick lacks momentum.
- Several factors contribute to the downward pressure on the JPY and provide some support to the pair.
- The USD remains near a 15-month low, limiting the potential for further gains.
Today's Scenario: -
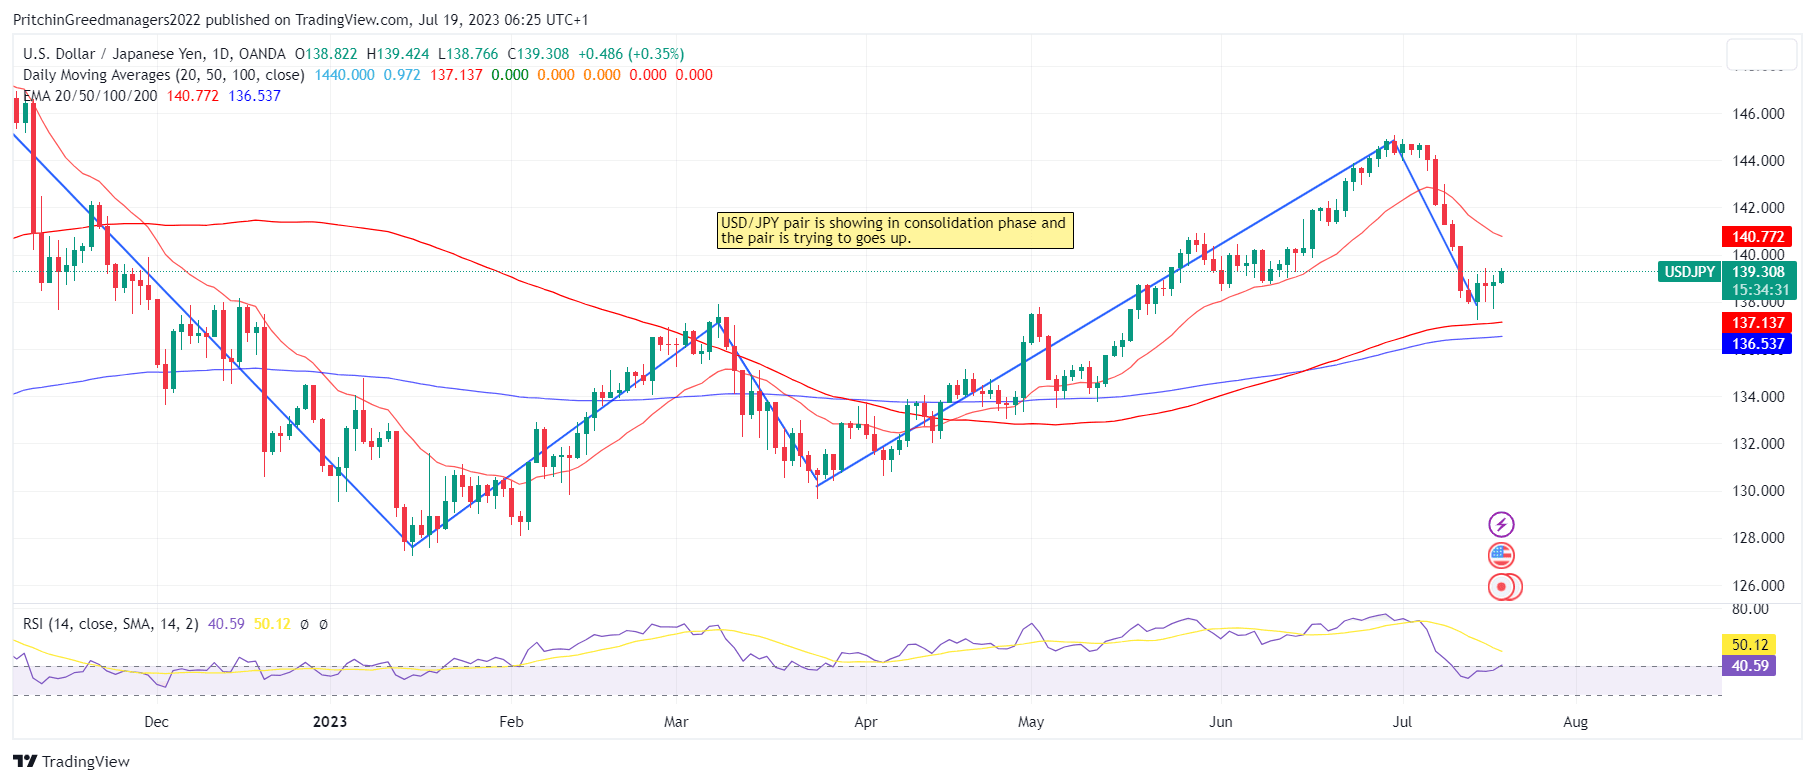
During Wednesday's Asian session, the USD/JPY pair shows a slight upward movement but lacks strong bullish momentum. It is currently trading around the 139.00 level, which is the upper end of a familiar range that has been held over the past week.
The overall bullish sentiment in global equity markets undermines the safe-haven appeal of the Japanese Yen (JPY), providing some support to the USD/JPY pair. Additionally, the less hawkish remarks made by Bank of Japan (BOJ) Governor Kazuo Ueda after the G20 meeting in India have further weighed on the JPY and contributed to the pair's modest intraday uptick. Ueda mentioned that there is still some distance to achieve the sustainable 2% inflation target and indicated that the narrative on monetary policy won't change unless there are significant shifts in the need to achieve the target.
However, the upside potential for the USD/JPY pair remains limited due to the subdued price action of the US Dollar (USD). The USD has struggled to gain meaningful traction after touching its lowest level since April 2022 on Tuesday. Market participants have been scaling back expectations of further rate hikes by the Federal Reserve (Fed) following the anticipated 25 bps lift-off in July. The recent US CPI report, indicating a moderation in consumer inflation, has reinforced these expectations and is likely to allow the US central bank to adopt a less hawkish stance. As a result, US Treasury bond yields have declined, keeping USD bulls on the defensive and potentially capping the upside for the USD/JPY pair.
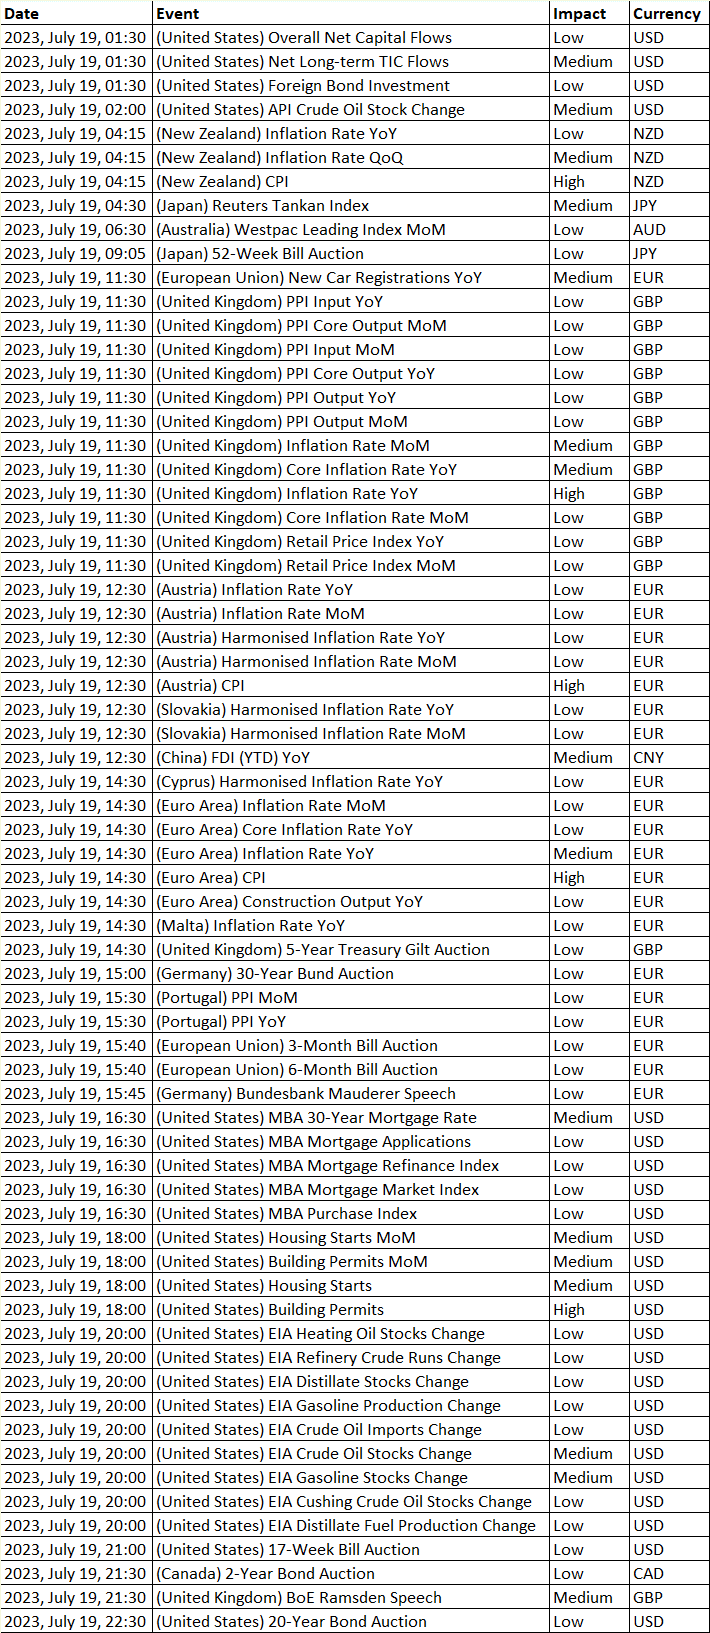
Considering the fundamental backdrop, it is advisable to wait for strong follow-through buying before confirming that the recent significant pullback from the year-to-date peak above the psychological level of 145.00 has reached its conclusion. Traders will now focus on the US housing market data, specifically Building Permits and Housing Starts, for potential market impetus later in the North American session.
Diagram of USD/JPY: -
Economic Events: -
Buy Scenario: -
From a technical standpoint, there has been a recent rebound in the USD/JPY pair from a confluence area formed by the significant 100-day and 200-day Simple Moving Averages (SMAs). This recovery has followed an upward-sloping channel pattern. However, considering the sharp pullback from levels just above 145.00, which was the year-to-date peak reached in June, the formation of a bearish flag pattern within this channel becomes apparent. Furthermore, the daily chart's oscillators are deeply negative, confirming the negative outlook for the USD/JPY pair.
Therefore, any subsequent upward movement is likely to encounter strong resistance near the upper boundary of the mentioned trend channel, currently around the 139.70 region. This resistance is closely followed by the 200-hour SMA, located just ahead of the psychological level of 140.00. A decisive breakthrough above this resistance zone would invalidate the bearish setup and trigger aggressive short-covering, potentially propelling the USD/JPY pair towards the intermediate hurdle at 140.45-140.50, and further towards the round figure of 141.00 and the supply zone of 141.25-141.30. Till we did not advise to buy in USD/JPY.
Sell Scenario: -
On the other hand, if the USD/JPY pair sustains weakness and falls below the 139.00 mark, it is likely to find support near the 138.40-138.35 region, followed by the key level of 138.00, which coincides with the support line of the trend channel. If selling pressure persists and extends below the weekly low, around the 137.70-137.65 region observed on Tuesday, it would confirm the breakdown of the bearish flag pattern and expose the confluence of the 100-day and 200-day SMAs near the 137.00 level. This scenario could potentially lead to a continuation of the recent downtrend witnessed over the past two weeks or so. Till we did not advise to sell the position in USD/JPY.
Support and Resistance Level: -
Support Resistance
S1 137.97 - R1 139.42
S2 137.10 - R2 140.00
S3 136.52 - R3 140.87


Discussion