

USD/JPY Jumps, Targets 143.00 Resistance Level as on 10-07-2023
USD/JPY Analysis
Key Points
- The USD/JPY pair is experiencing buying interest, leading to a rally towards the vicinity of the 143.00 region.
- Investors are analyzing the US labor data and forming the belief that the Federal Reserve (Fed) may not raise interest rates twice this year.
- The potential for foreign exchange (FX) intervention by the Japanese central bank could limit the upward movement of USD/JPY.
- Traders may choose to adopt a cautious approach and wait on the sidelines before the release of significant US economic data.
Today's Scenario: -
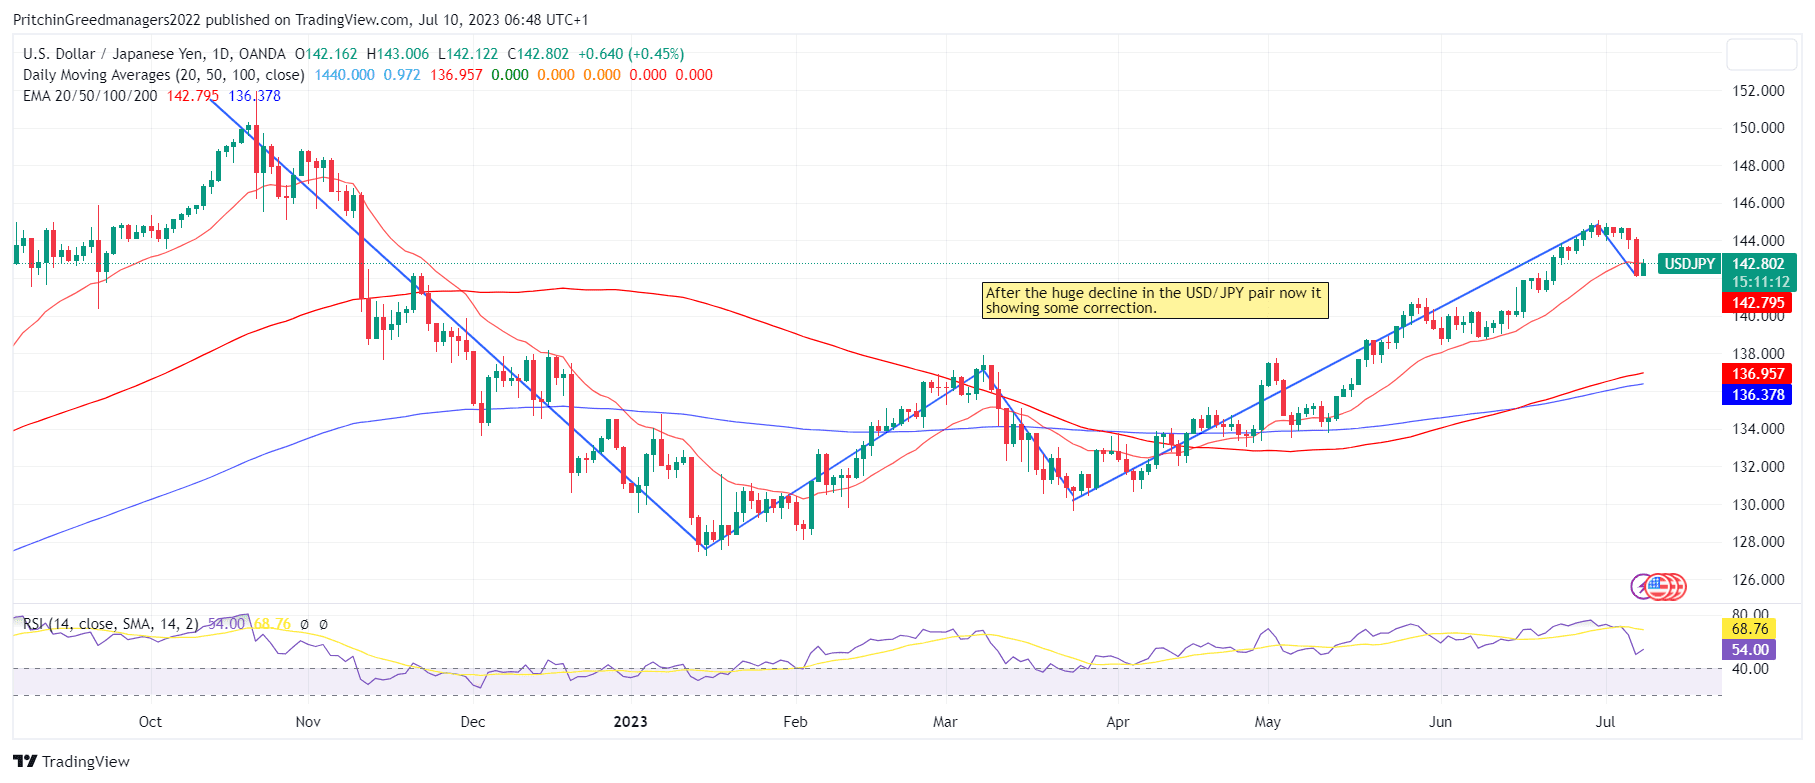
During the Asian session, the USD/JPY pair exhibits a surge in momentum, rallying near the 143.00 threshold and recording a 0.57% increase for the day. Recovering from Friday's decline, the major pair bounces back from its over-a-one-week low at 142.06, as the US Dollar Index (DXY) stages an impressive comeback early on Monday.
On Friday, the Labor Department released a highly anticipated employment report, indicating that the US economy added jobs at a slower pace than expected in June. The US Nonfarm Payrolls (NFP) experienced a rise of 209,000 in June, a decrease from the 306,000 jobs added in May. Additionally, the Unemployment Rate dropped from 3.7% to 3.6% in June, while Average Hourly Earnings remained unchanged at 0.4%, surpassing the market expectation of 0.3%.
Following the release of weaker US data, the USD/JPY witnessed a significant drop, reaching a one-week low. However, it rebounds strongly during Monday's Asian session, aligning with the recovery of the US Dollar and the rise in US Treasury bond yields.
The US labor data suggests that the Federal Reserve (Fed) may not pursue two rate hikes this year, as previously anticipated.
Despite this, market participants remain convinced that the US Federal Reserve (Fed) will raise rates by 25 basis points (bps) at the policy meeting on July 25-26, according to the CME Group's FedWatch Tool. Currently, the odds stand at 92.4%, higher than the previous week's 86.8%. Consequently, this supports the renewed upward movement of US Treasury bond yields, resulting in a broad-based strengthening of the US Dollar.
According to Reuters, the latest data from the Ministry of Finance reveals that Japan's current account surplus in May more than doubled compared to the previous year, marking the fourth consecutive month of gains. This growth can be attributed to the narrowing of the country's trade deficit and increased income from overseas investments.
Based on a Reuters poll, the current account surplus in May reached 1.86 trillion yen ($13.08 billion), compared to 773 billion yen year-on-year, falling slightly short of the median forecast of a surplus of 1.88 trillion yen.
Nevertheless, the potential intervention in foreign exchange (FX) markets by the Japanese central bank could limit the upside potential of USD/JPY. Masato Kanda, the top currency diplomat, mentioned his ongoing communication with various countries, including the US, regarding currencies, according to Reuters.
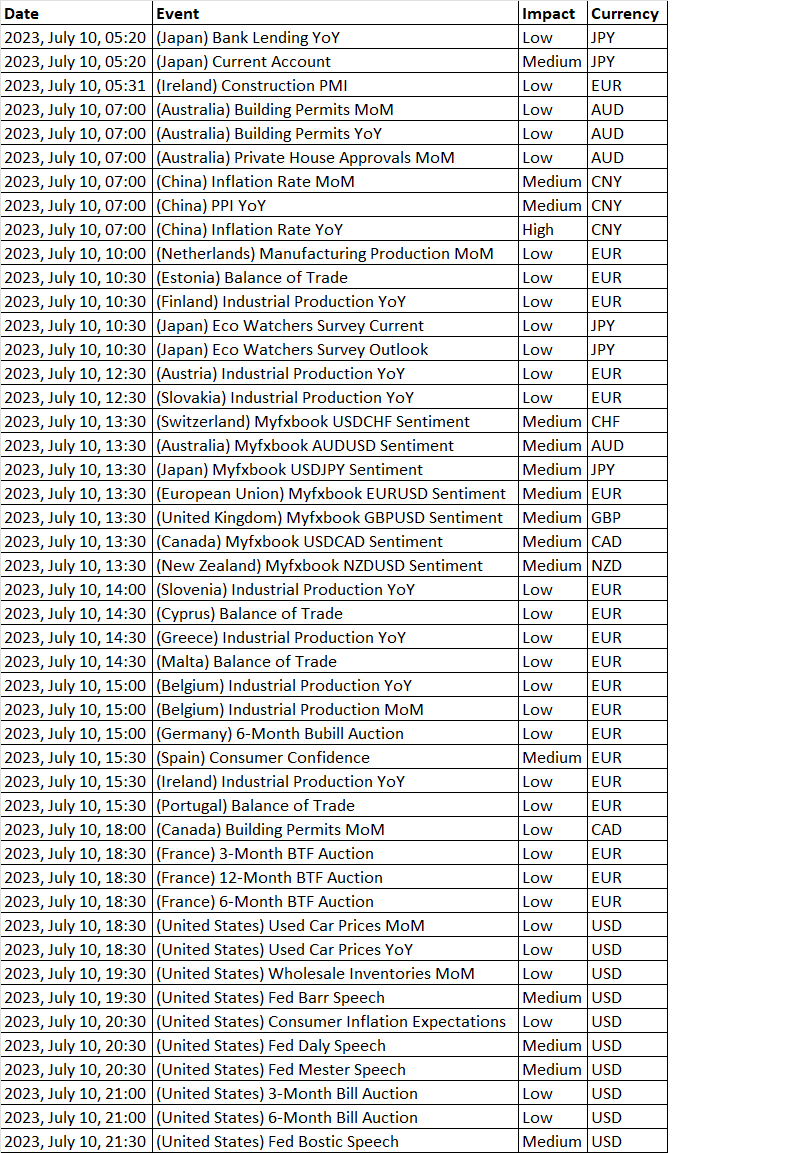
Looking ahead, market participants will closely monitor the release of the US Consumer Price Index (CPI), the Producer Price Index (PPI), and the University of Michigan Preliminary Consumer Sentiment for July later in the week. Additionally, the Japanese Producer Price Index (PPI) year-on-year and revised Industrial Production month-on-month figures will be featured on Wednesday and Friday, respectively. Traders may choose to remain on the sidelines until these key data points are released.
Diagram of USD/JPY: -
Economic Events: -
Buy Scenario: -
On the Daily Chart, the USD/JPY experienced a decline, breaking below the psychological support level at 143 and testing the support around 142 and the upper boundary of the support range between 141.9 and 141.2. Despite the sell-off on Friday, the USD/JPY managed to stay above both the 50-day (140.276) and 200-day (136.279) Exponential Moving Averages (EMAs), indicating a positive outlook for the short and long term.
Notably, the 50-day EMA continued to distance itself from the 200-day EMA, reinforcing the bullish momentum. Till we did not advise to buy in USD/JPY.
Sell Scenario: -
Examining the 14-Daily Relative Strength Index (RSI), the reading of 49.72 suggests a moderately bearish sentiment, implying the possibility of further testing the lower boundary of the support range. If the price falls below the lower level of the 141.9 – 141.2 support range, it would bring the 50-day EMA (140.276) into focus. Till we did not advise to sell the position in USD/JPY.
Support and Resistance Level: -
Support Resistance
S1 141.41 - R1 143.54
S2 140.68 - R2 144.93
S3 139.28 - R3 145.67


Discussion