

USD/CHF Price Analysis: Consolidation near Multi-Year Low- 19-07-2023.
USD/CHF Analysis
Key Points: -
- The USD/CHF pair is facing difficulties in making a substantial recovery from the multi-year low reached on Tuesday.
- The current risk-on sentiment in the market weakens the safe-haven appeal of the Swiss Franc (CHF) and provides support for the pair.
- The upside potential is limited due to the bearish outlook for the US Dollar (USD) and expectations of a shift in the Federal Reserve's policy stance.
Today's Scenario: -
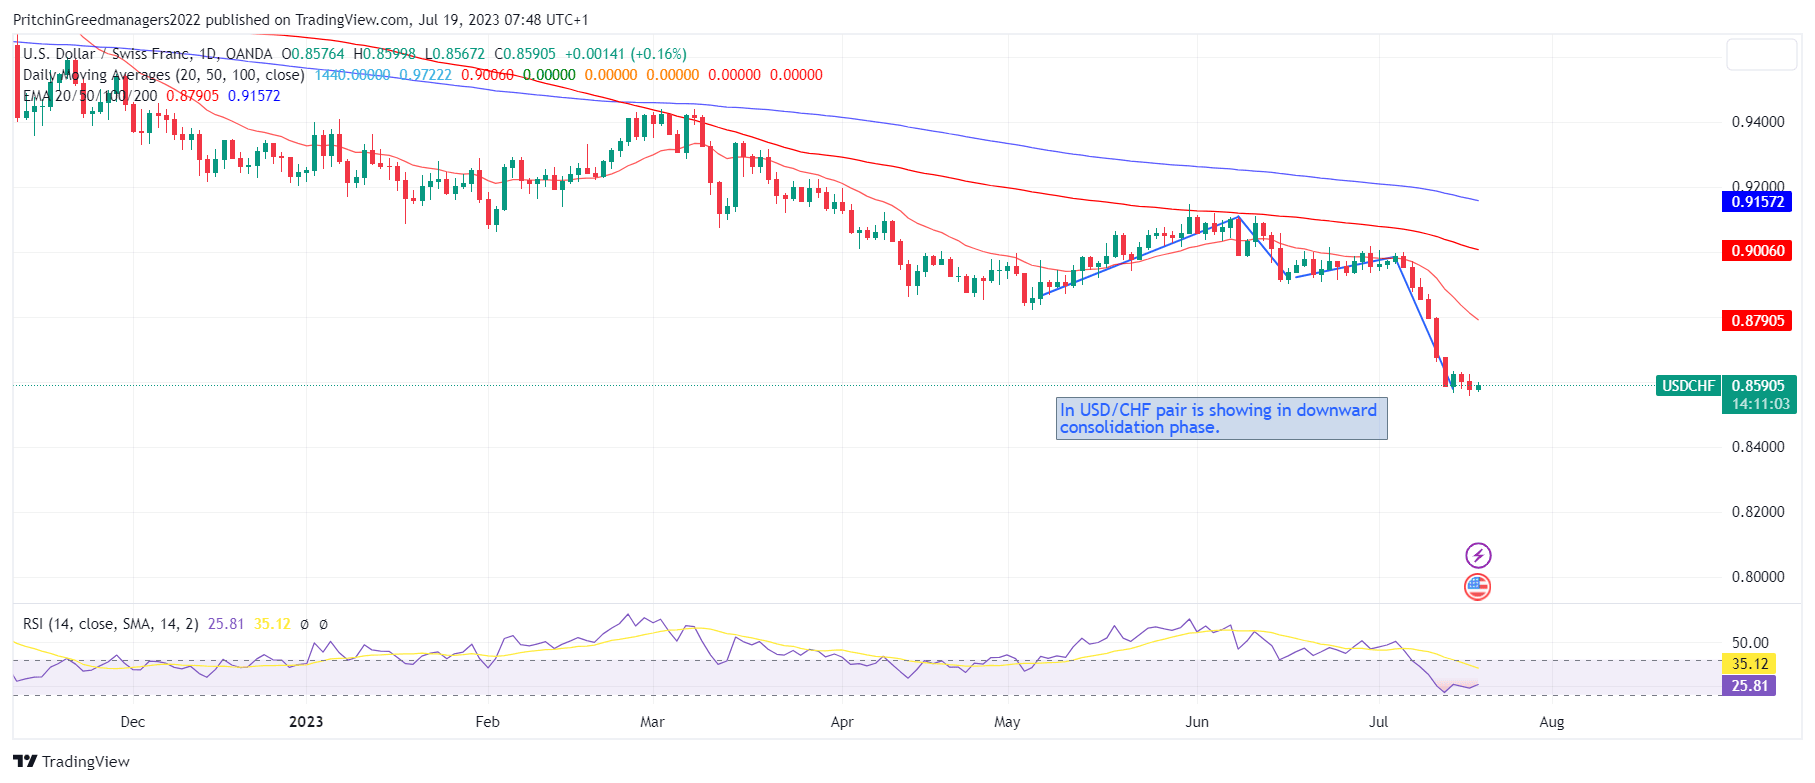
The USD/CHF pair is trading within a narrow range, approximately around the 0.8575-0.8580 region, during the Asian session on Wednesday. It is consolidating after reaching its lowest level since January 2015 in the previous session.
The current risk-on environment is undermining demand for the safe-haven Swiss Franc (CHF), which is providing some support to the USD/CHF pair. Weaker economic data from China earlier this week has raised speculations about potential government stimulus measures. This has alleviated concerns over slowing economic growth in China and boosted investor confidence, resulting in a recent rally across global equity markets.
However, the overall bearish sentiment surrounding the US Dollar (USD) is acting as a headwind and preventing meaningful buying in the USD/CHF pair. The USD Index (DXY), which tracks the performance of the USD against a basket of currencies, remains close to its lowest level since April 2022, as investors anticipate a more dovish stance from the Federal Reserve (Fed) following the expected 25 basis points rate hike in July.
The US Consumer Price Index (CPI) report, which indicated a moderation in consumer prices, further supported expectations of the Fed reaching the end of its tightening cycle. Additionally, the release of US Retail Sales data for June, which showed a lower-than-expected increase, and the unexpected decline in Industrial Production for the same month added to the belief that the Fed may pause its current policy tightening cycle. This has led to a decline in US Treasury bond yields and continued to weigh on the USD.
However, the resilience in core US Retail Sales, excluding certain categories, has raised doubts about whether the Fed will fully commit to a more dovish policy stance or stick to its forecast of a 50 basis points rate hike this year. This has restrained traders from placing further bearish bets on the USD. Furthermore, oversold technical indicators on the daily chart support the possibility of near-term consolidation or a modest corrective bounce for the USD/CHF pair.
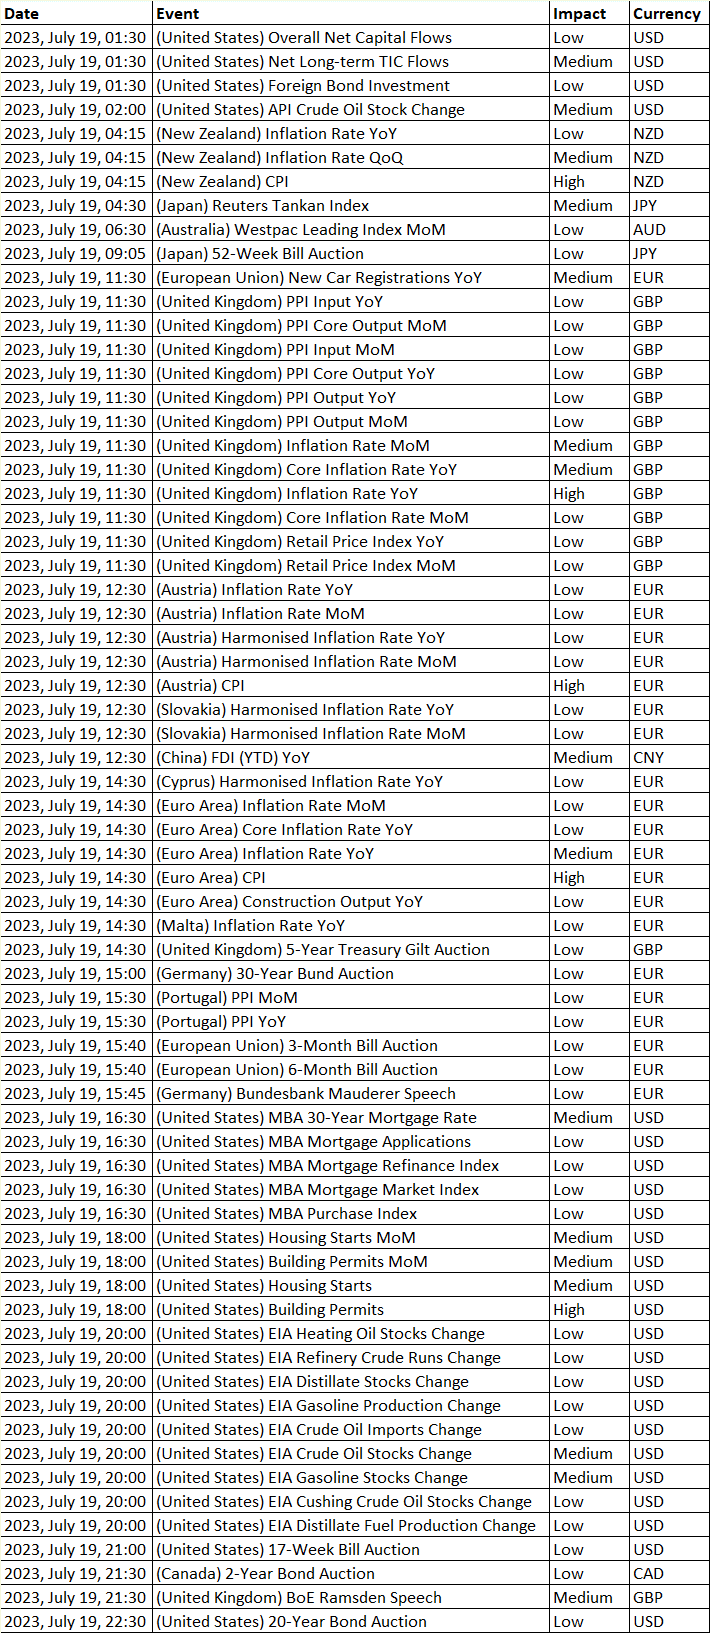
Market participants will be focusing on US housing market data, including Building Permits and Housing Starts, for further direction during the early North American session. Additionally, US bond yields and broader market risk sentiment will influence USD demand. These factors, combined with the overall fundamental backdrop, suggest that the path of least resistance for the USD/CHF pair is to the downside.
Diagram of USD/CHF: -
Economic Events : -
Buy Scenario: -
The USD/CHF chart currently shows a bullish momentum, indicating the potential for a bullish rebound from the first support level and a subsequent move towards the first resistance level.
The first support level at 0.8529 is noteworthy as it coincides with a 100% Fibonacci Projection. This convergence of factors adds to the significance of this support level.
Furthermore, the second support level at 0.8445 is identified as a level that corresponds to a -61.8% Fibonacci Expansion, further strengthening its potential as a support level.
On the upside, the first resistance level at 0.8759 is classified as a pullback resistance. This resistance level may act as a barrier to further upward price movement. Till we do not advise to buy USD/CHF.
Sell Scenario: -
The USD/CHF pair has successfully broken below the support line of a bearish pennant pattern, which confirms the negative implications of this pattern. This reinforces expectations for a continued bearish trend in the intraday and short-term outlook, with the next main targets expected at 0.8520 followed by 0.8450 levels.
The presence of the 50-day Exponential Moving Average (EMA50) continues to provide support for the anticipated bearish wave. It's worth noting that if the price manages to breach the level of 0.8670, it would halt the expected decline and potentially initiate a bullish correction in the intraday timeframe. Till we do not advise to sell USD/CHF.
Support and Resistance Level: -
Support Resistance
S1 0.8551 - R1 0.8604
S2 0.8527 - R2 0.8632
S3 0.8499 - R3 0.8656


Discussion