
US Dollar Index (DXY) Price Analysis: Licking Its Wounds 17-07-2023
US Doller Index Analysis
Key Points: -
- The US Dollar Index remains cautious as it rebounds from its lowest point in 15 months.
- Concerns regarding the policy shift of the US central bank are fueled by Friday's US data and previous discussions, supporting the stability of the DXY price.
- Sentiment is influenced by China-related news and the pre-Fed blackout, resulting in the US Dollar recovering from recent losses.
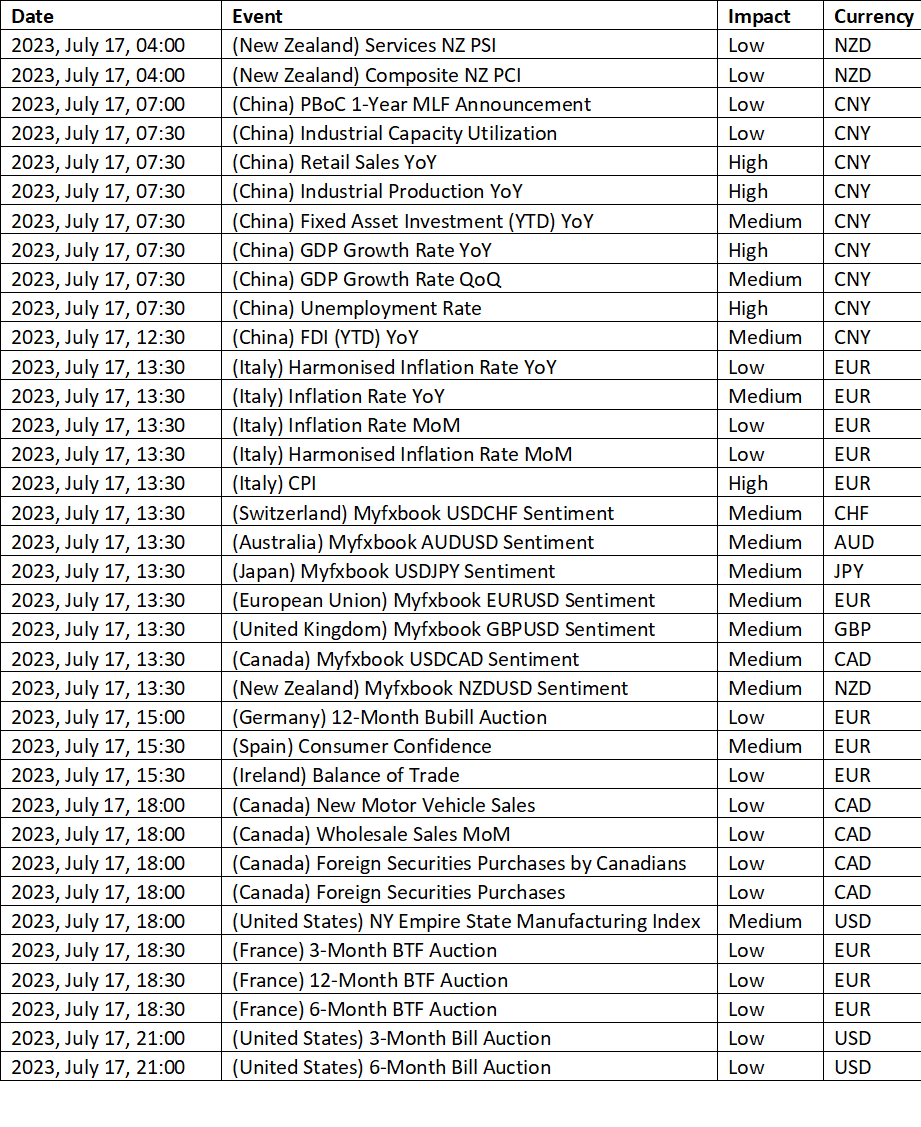
- Market participants are keeping an eye on the NY Empire State Manufacturing Index and US Retail Sales for further guidance, while the key factors driving risk remain significant.
Today's Scenario: -
The US Dollar Index (DXY) remains range-bound around 99.90-95 as it struggles to defend its recent rebound from the lowest levels seen since April 2022 during the sluggish Asian session on Monday. Consequently, the gauge of the US Dollar against six major currencies takes a breather following its largest weekly decline since November 2022.
Last week, disappointing US inflation data weighed heavily on the DXY, but the release of positive US economic data the previous day provided some support to the greenback. Additionally, concerns about China and the International Monetary Fund's statements on inflation contributed to the corrective bounce.
On Friday, the preliminary reading of the University of Michigan's Consumer Confidence Index for July came in at 72.6, up from June's 64.4 and surpassing market expectations of 65.5. Furthermore, the survey indicated higher one-year and five-year consumer inflation expectations at 3.4% and 3.1%, respectively, compared to the previous readings of 3.3% and 3%. Prior to that, the US Consumer Price Index (CPI) and Producer Price Index (PPI) for June showed a decline on a yearly basis, with figures of 3.0% and 0.1%, respectively, compared to the previous readings of 4.0% and 0.9% YoY. These releases contributed to the weakening of the US Dollar and propelled the EUR/USD pair to its highest level since February 2022.
Meanwhile, the International Monetary Fund (IMF) mentioned concerns about short-term inflationary pressures, which supported the rebound of the US Dollar Index from multi-month lows. Additionally, fears regarding the US-China tension, highlighted by comments from New Zealand Prime Minister Chris Hipkins and US Treasury Secretary Janet Yellen, further bolstered the DXY's corrective bounce.
It is worth noting that concerns about China's economic recovery, based on initial forecasts of key China data, also weighed on sentiment and provided support to the DXY.
In the current market environment, S&P500 Futures show mild losses, while US Treasury bond yields remain steady due to Japan's holiday.
Looking ahead, China's second-quarter GDP data for 2023 will be crucial in determining short-term movements of the DXY, along with the upcoming US Retail Sales report for June, scheduled for release on Wednesday. Additionally, the US NY Empire State Manufacturing Index for June will also have an impact on intraday fluctuations of the US Dollar Index, alongside China data and other risk catalysts.
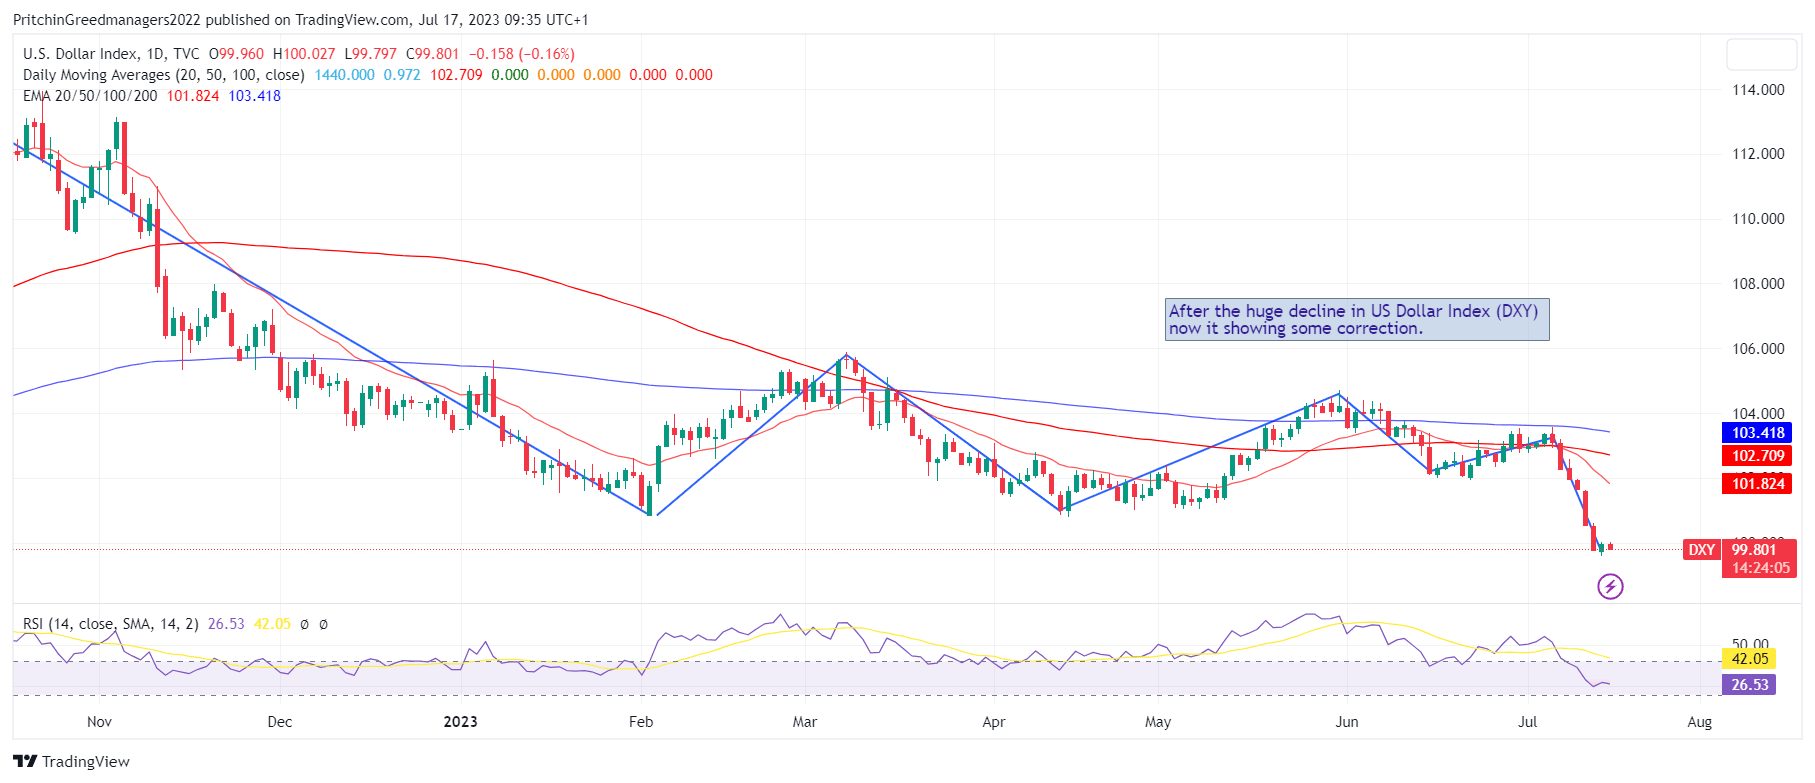
Diagram of US Dollar Index (DXY): -
Economic Events : -
Buy Scenario: -
On the upside, the first resistance level lies at 100.84. It is considered a pullback resistance, implying that the price might face selling pressure and potentially reverse its upward direction upon reaching this level.
Additionally, the second resistance level is positioned at 101.94. This is an overlap resistance level, signifying a price point where the market has previously encountered significant selling pressure. If the price ascends to this level, it could attract sellers who might exert downward pressure on prices. Till we do not advise to buy US Dollar Index.
Sell Scenario: -
The current chart of the US Dollar Index (DXY) indicates a bearish momentum. However, there is a possibility of a bullish rebound from the first support level, leading the market towards the first resistance level.
The first support level is located at 99.42. It serves as both an overlap support and a 100% Fibonacci Projection level. This suggests that the market has previously shown buying interest at this price, potentially causing an upward bounce.
Furthermore, the second support level sits at 97.72. Like the first support, this is also an overlap support, indicating a historically strong buying interest in this price range. If the price continues to decline, it may find support from buyers at this level.
Till we do not advise to sell in US Dollar Index
Support and Resistance Level: -
Support Resistance
S1 99.68 - R1 100.11
S2 99.41 - R2 100.28
S3 99.24 - R3 100.55


Discussion