

US Dollar Index Bears Weigh In Below 100.00 Ahead of Retail Sales- 18-07-2023
US Doller Index Analysis
Key Points: -
- The US Dollar Index experienced a slight decline after rebounding from its 15-month low on Friday, exhibiting sluggishness in recent times.
- The cautious optimism surrounding Monday's US data has put pressure on the DXY (US Dollar Index) due to the pre-FOMC blackout period.
- The news from China and the upcoming US Retail Sales report have the potential to arouse the interest of the bulls of the US Dollar Index, especially considering its multi-month low position.
Today's Scenario: -
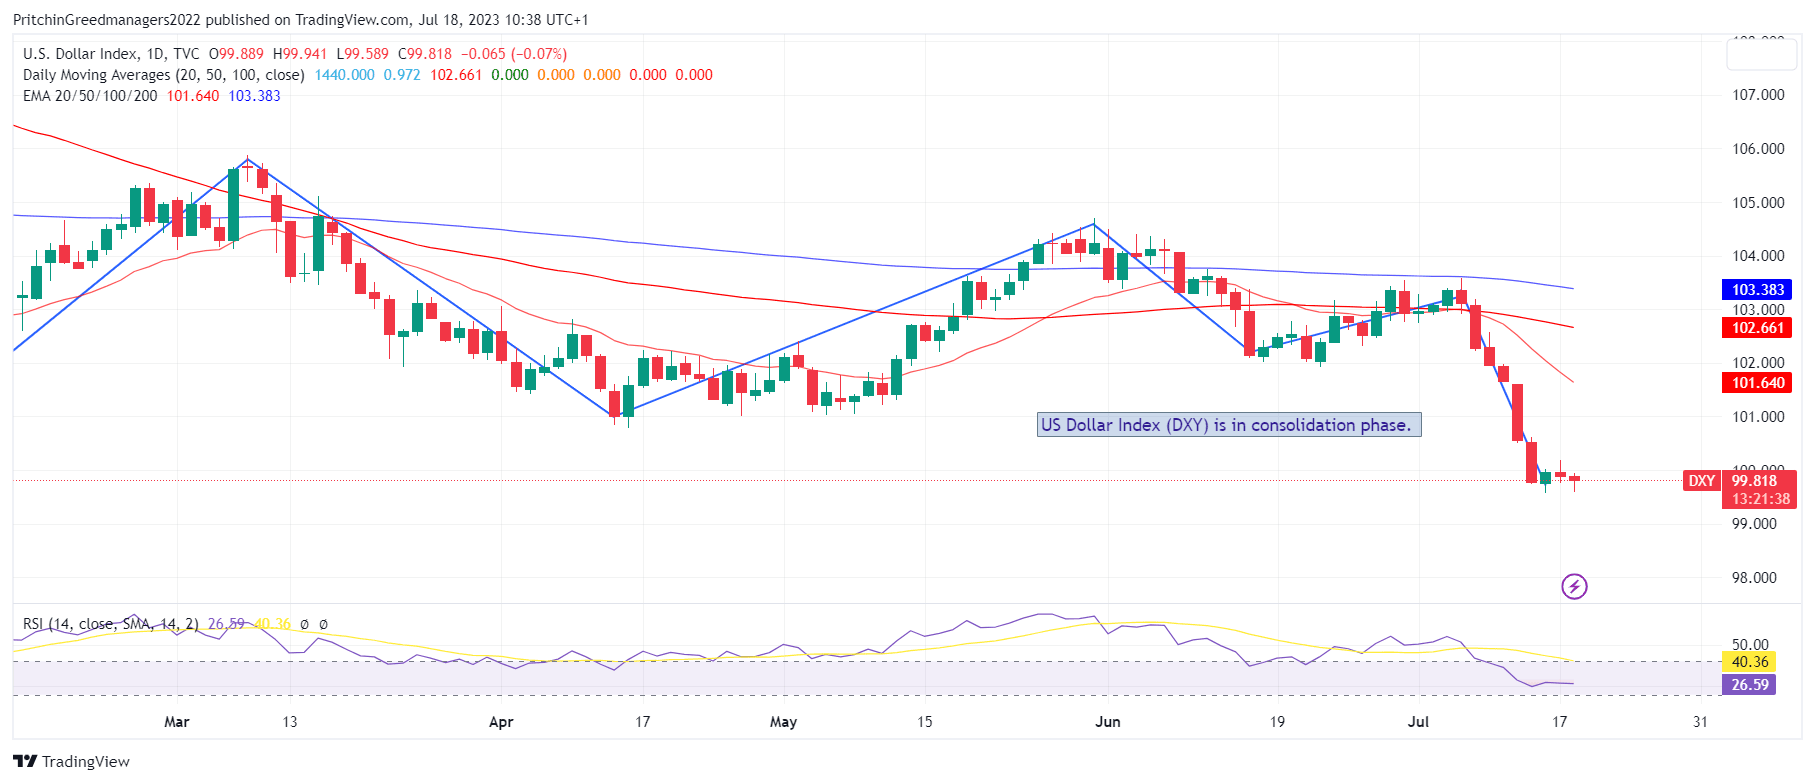
The US Dollar Index (DXY) continues to face downward pressure around 99.85, marking a fresh intraday low. Consequently, the greenback's gauge against six major currencies shows slight losses during the early hours of Tuesday, following an unsuccessful attempt to extend the corrective rebound observed on Friday from its lowest level since April 2022.
The DXY's decline can be attributed to a combination of factors. Firstly, Monday's underwhelming US data, coupled with concerns over China's economic recovery and the anticipation of no significant hawkish moves from the Federal Reserve (Fed) following last week's disappointing US inflation figures, have contributed to the downward pressure on the DXY amid mixed concerns.
In addition, Wall Street closed with marginal gains, and US Treasury bond yields experienced a slight decrease, further weighing on the US Dollar Index (DXY).
Furthermore, the New York (NY) Empire State Manufacturing Index for July declined to 1.1 from the previous reading of 6.6, falling short of market expectations of 0.0. Initially, this data failed to inspire DXY sellers but eventually weighed on the index, challenging Friday's recovery supported by positive readings of the University of Michigan's (UoM) Consumer Sentiment Index and consumer inflation expectations for the same month.
Elsewhere, China's Gross Domestic Product (GDP) for the second quarter of 2023 confirmed the market's concerns regarding the slowdown in the recovery of the world's largest industrial and second-largest economy. Mixed updates on the US-China relationship also contributed to supporting the DXY.
On Monday, US Treasury Secretary Janet Yellen mentioned in a Bloomberg interview that the US is carefully examining outbound investment controls on China, with a specific focus on certain sectors. However, Yellen clarified that these controls would not have a broad impact on the investment climate in China. Over the weekend, Yellen spoke at a meeting of Group of 20 (G20) finance ministers and central bankers in India, expressing eagerness to build upon the progress made in Beijing and mobilize further action. Consequently, the US-China tension remains in the spotlight, although the level of pessimism appears to be slow and mixed.
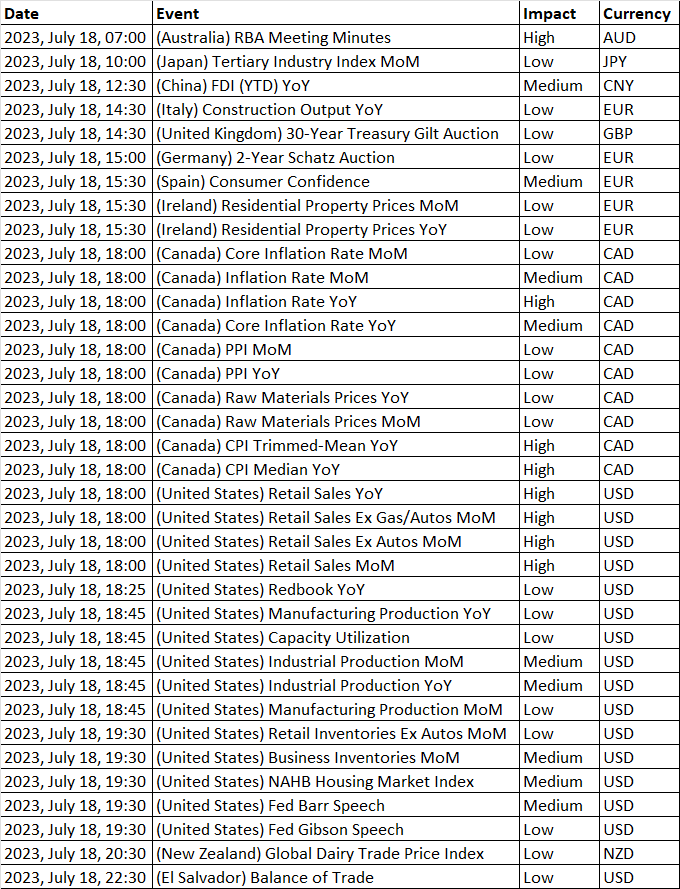
In summary, the DXY is burdened by market concerns about the dovish stance of the Fed, despite the positive consumer-centric figures observed on Friday. The upcoming US Retail Sales data for June, expected to increase by 0.5% compared to the previous 0.3%, will be crucial in providing clear indications for the DXY's direction. Additionally, the US Industrial Production data for June, anticipated to be -0.1% versus the previous -0.2%, along with US-China headlines and movements in the bond market as Japan returns from an extended weekend, will be important factors to monitor.
Diagram of US Dollar Index (DXY): -
Economic Events : -
Buy Scenario: -
On the upside if the price begins to rise, it could encounter resistance at 100.84, which is identified as pullback resistance. Additionally, the 2nd resistance level at 101.99, characterized as an overlap resistance, might present further obstacles to upward price movements. These resistance levels could elicit a selling response and impede the price from advancing further.
It's important to note that the analysis provided is based on the current chart pattern and historical price levels. Market conditions and other factors can impact the actual price movement, so careful monitoring and analysis are necessary to make informed trading decisions. Till we do not advise to buy US Dollar Index.
Sell Scenario: -
The current chart of the DXY (US Dollar Index) indicates a bearish momentum, suggesting a potential continuation of the price's downward movement towards the 1st support level.
The 1st support level is situated at 99.42, which is considered as a significant support area. If the price breaches this level, it may continue its bearish trajectory towards the 2nd support level at 97.72, which is also recognized as a notable support region. These support levels represent crucial zones where buying interest could surpass selling pressure, potentially resulting in a price rebound. Till we do not advise to sell in US Dollar Index
Support and Resistance Level: -
Support Resistance
S1 99.71 - R1 100.14
S2 99.52 - R2 100.37
S3 99.28 - R3 100.57


Discussion