
US Dollar Index Analysis: Recovery Stalls amid Fed Concerns- 19-07-2023
US Doller Index Analysis
Key Points: -
- The US Dollar Index pulls back from its intraday high and reverses its corrective bounce after reaching the lowest level since April 2022.
- The positive aspects of US Retail Sales growth provide support to the US Dollar Index at its multi-month low.
- Speculation that the Federal Reserve's rate hike in July could be the last, combined with the prevailing risk-on sentiment, puts downward pressure on the greenback.
Today's Scenario: -
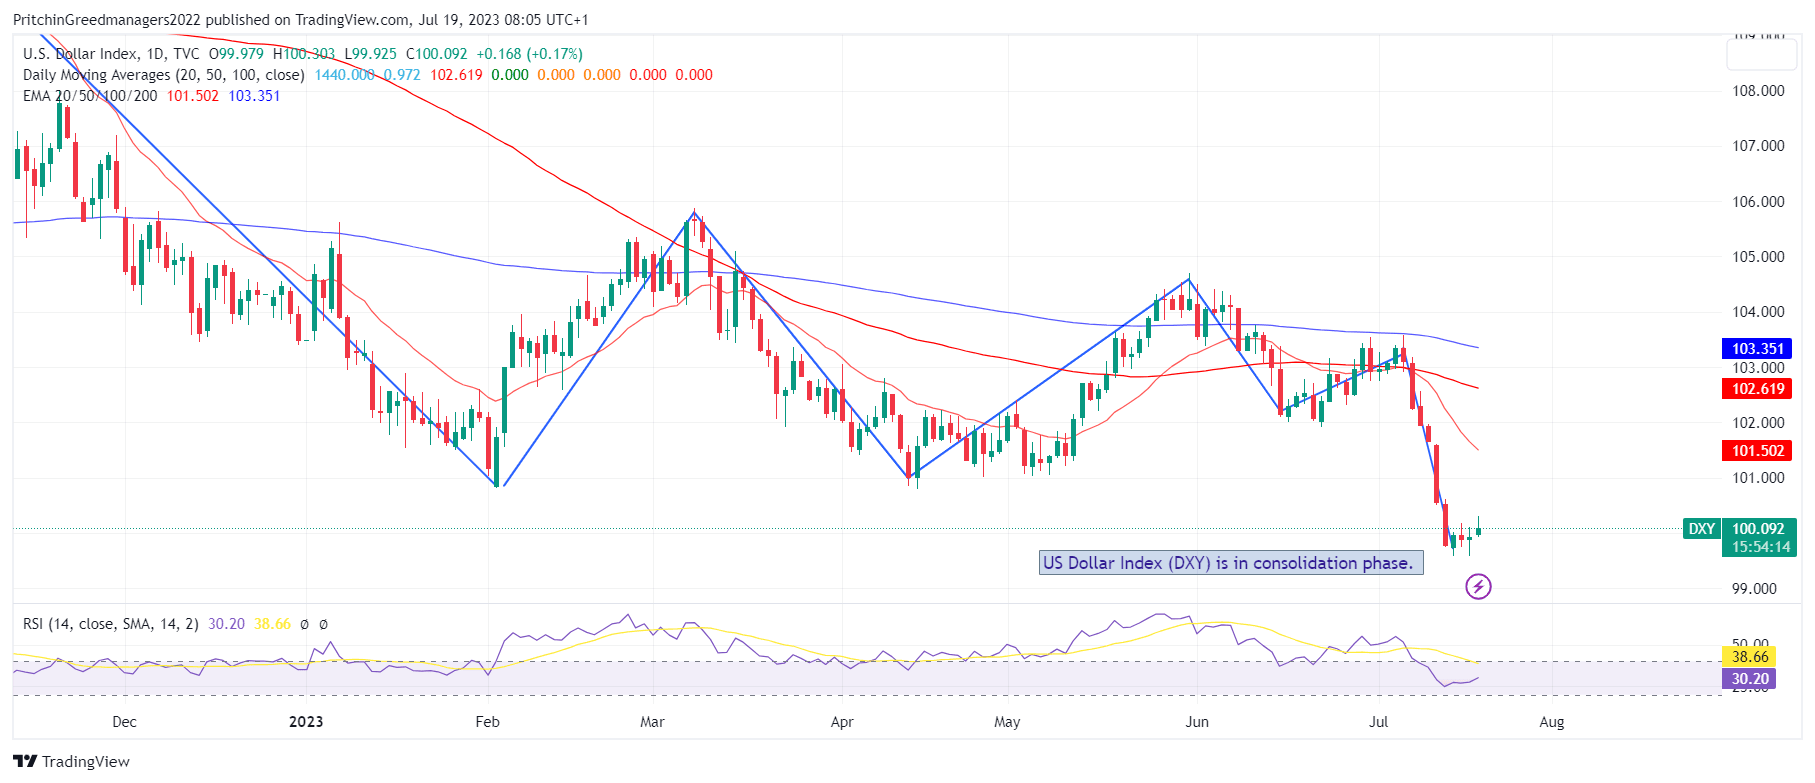
The US Dollar Index (DXY) is facing challenges in maintaining its corrective bounce from a multi-month low, retreating from its intraday high to 99.93 during the early Asian session on Wednesday.
The positive readings of the US Core Retail Sales for June supported the DXY's recovery from its lowest level since April 2022. However, with a risk-on sentiment prevailing and talks of a potential policy pivot by the US Federal Reserve (Fed), the US Dollar bulls are being encouraged in the absence of major data or events.
According to a recent Reuters poll of around 109 economists, the widely anticipated 25 basis points rate hike by the Fed in July is expected to be the last increase in the current tightening cycle.
It is worth noting that the improved risk appetite is driven by the positive performance of US banks and positive headlines related to China, which have allowed Wall Street benchmarks to reach new yearly highs. However, it should be mentioned that benchmark US 10-year Treasury bond yields remain under pressure around 3.78%, while the two-year yields have edged higher to approximately 4.76%.
Regarding US data, Retail Sales growth for June came in at 0.2% month-on-month, falling short of the expected 0.5% and revised previous reading. However, the Retail Sales Control Group showed growth of 0.6%, surpassing market forecasts of -0.3% and the previous reading of 0.3%. US Industrial Production for June printed at -0.5%, missing analysts' estimations of 0.0%.
Looking ahead, with a light economic calendar, the US Dollar Index's intraday moves may be limited, potentially triggering a pullback towards the multi-month low of 99.56 seen the previous day. Therefore, it is crucial to monitor risk catalysts for short-term market directions.
Diagram of US Dollar Index (DXY): -
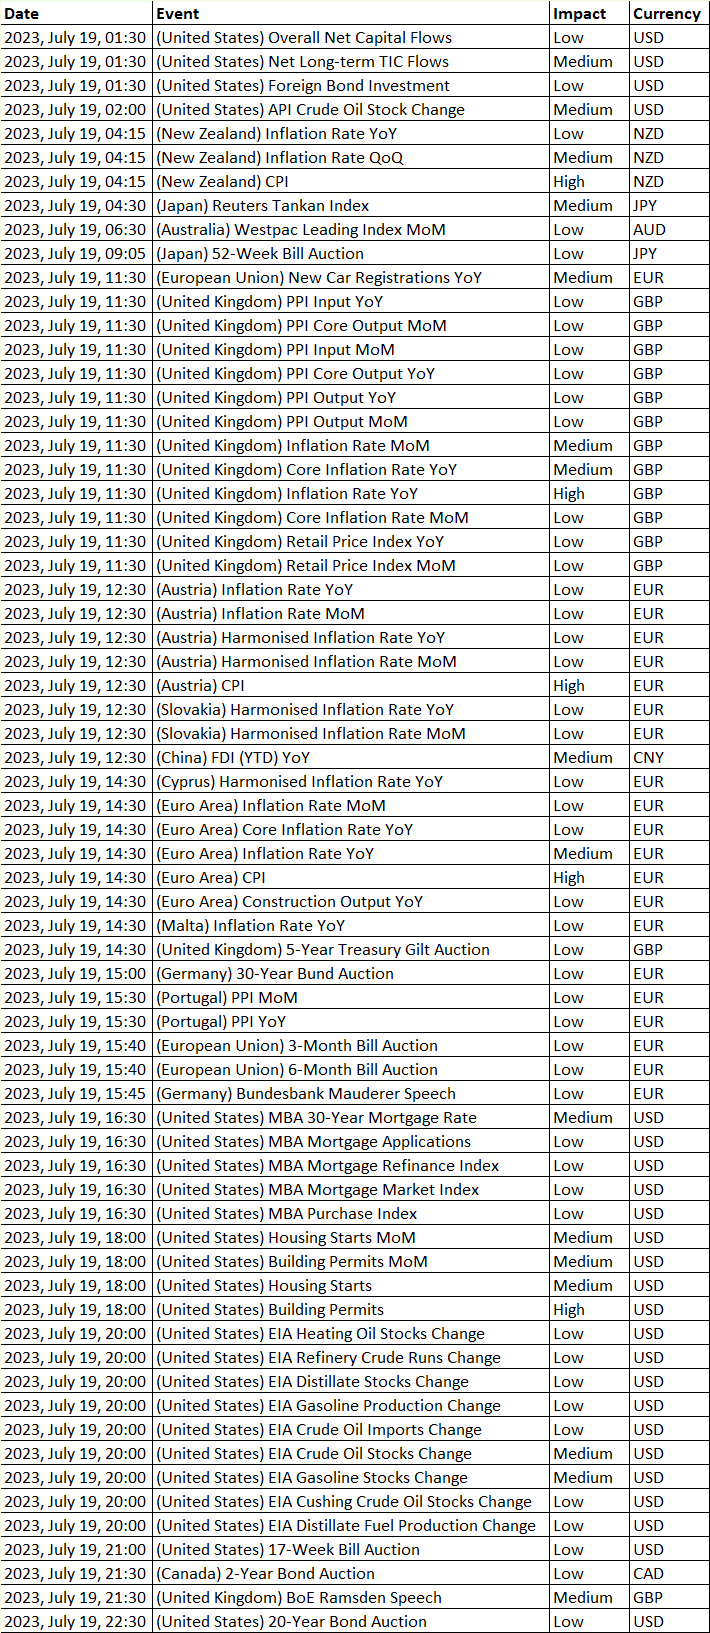
Economic Events : -
Buy Scenario: -
The current chart analysis of the dollar index (DXY) suggests a bullish momentum, indicating the potential for a continuation of the upward movement towards the first resistance level.
The intermediate support level at 99.66 is identified as a support level based on previous swings, potentially acting as a barrier to any short-term downtrend.
The first support level at 99.42 is recognized as an overlap support, which could serve as a rebound point if the price experiences further downward movement.
If the bullish momentum persists, the price might encounter resistance at 100.84, which is considered an overlap resistance. This level could present a challenge to the upward price movement.
A sustained rise in price could lead to the second resistance level at 101.99. This level is characterized as an overlap resistance and also aligns with the 61.80% Fibonacci retracement level, adding to its significance as a potential turning point. Till we do not advise to buy US Dollar Index.
Sell Scenario: -
The US Dollar Index (DXY) is currently in oversold territory, as indicated by the 14-period Relative Strength Index (RSI). This, along with the presence of multiple resistance levels formed in early 2022, is expected to provide support and restrict further downside for the DXY in the short term, specifically around the 99.40-99.35 region. However, it is worth noting that a significant corrective bounce is unlikely unless the index manages to surpass the previous low recorded in April, which is approximately around 100.80. Till we do not advise to sell in US Dollar Index
Support and Resistance Level: -
Support Resistance
S1 99.64 - R1 100.18
S2 99.34 - R2 100.41
S3 99.10 - R3 100.72


Discussion