

NZD/USD Price Analysis: Embracing Positive Momentum- 17-07-2023
NZD/USD Analysis
Key Points: -
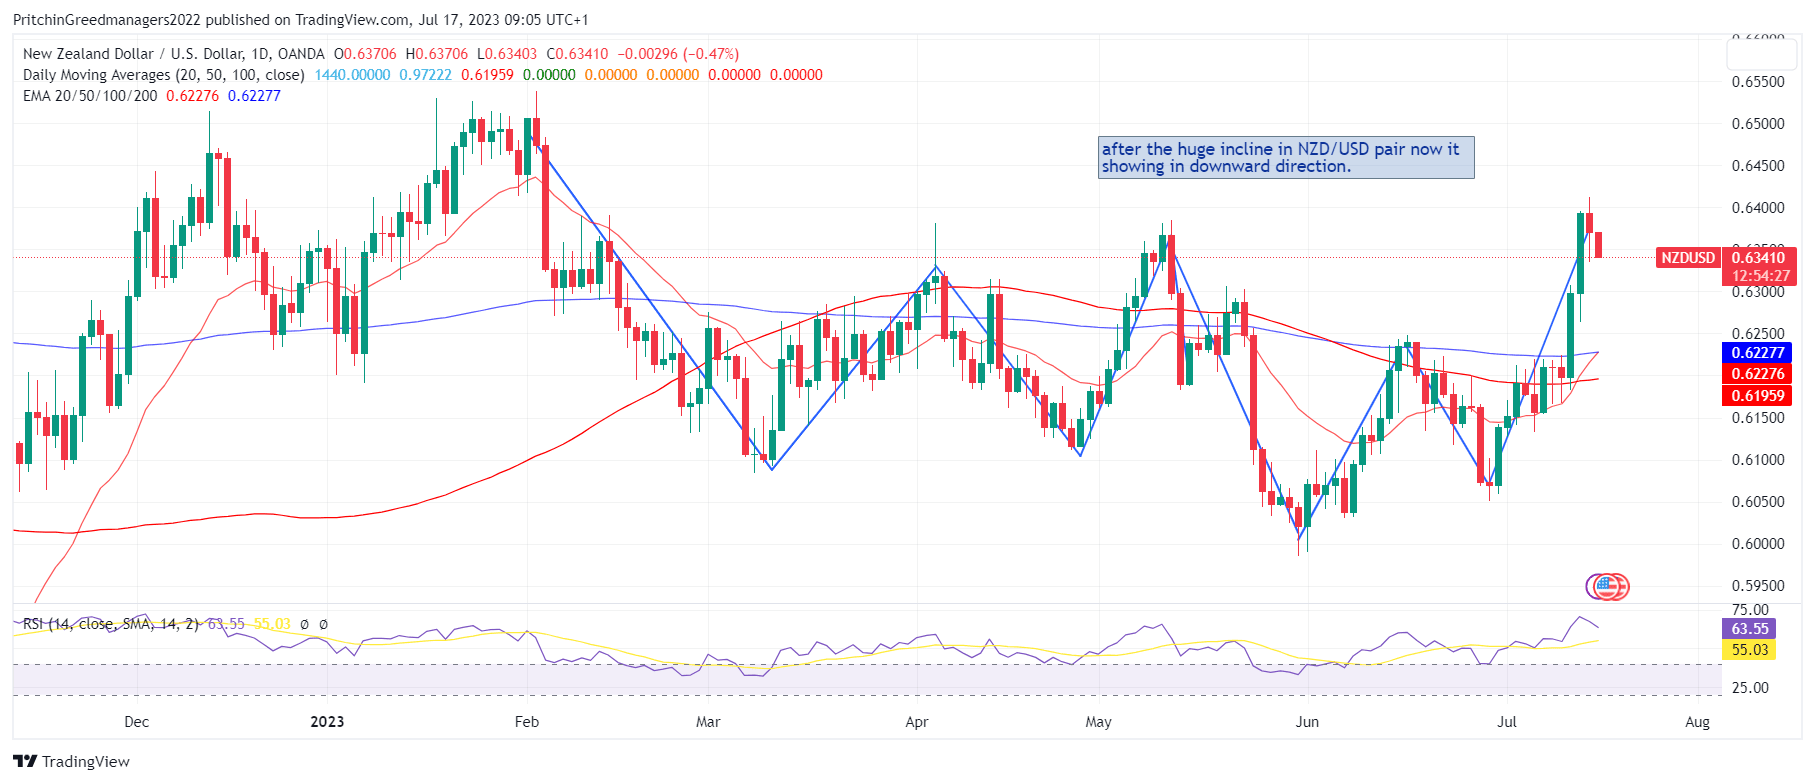
· The NZD/USD pair has declined and is trading near the 0.6350 level, even though the USD Index has been experiencing volatility in its movement.
· Market expectations suggest that New Zealand's inflation is likely to decrease significantly due to the Reserve Bank of New Zealand's (RBNZ) aggressive interest rate policy
· The USD Index is striving to make a strong recovery following a notable sell-off period.
Today's Scenario: -
The NZD/USD pair has continued its correction and is currently trading near 0.6350 in the early European session. The New Zealand dollar has faced downward pressure following the release of mixed Gross Domestic Product (GDP) data from China. China's quarterly GDP expanded by 0.8%, surpassing expectations of 0.5%, but it was significantly lower than the previous reading of 2.2%. The annualized GDP figure came in at 6.3%, lower than the consensus of 7.3% but higher than the previous release of 4.5%.
The mixed GDP numbers have increased the need for looser monetary policy from the People's Bank of China (PBoC) as the economic recovery in China faces challenges such as lower consumer spending and difficulties in the real estate sector. Given that New Zealand is a major trading partner of China, any weakness in China's economic recovery has an impact on the New Zealand Dollar.
In addition to the GDP figures, annual Retail Sales in China have decelerated to 3.1% compared to the expected 3.2% and the previous reading of 12.7%. However, annualized Industrial Production has jumped to 4.4% exceeding the consensus of 2.7% and the previous figure of 3.5%.
Looking ahead, the New Zealand Dollar's performance will likely be influenced by the release of second-quarter inflation data, scheduled for Tuesday at 22:45 GMT. The quarterly Consumer Price Index (CPI) is expected to soften to 0.9% compared to the previous reading of 1.2%. The annualized CPI is also anticipated to decelerate to 5.9% from the previous release of 6.7%.
Meanwhile, S&P500 futures have experienced minor losses in Asia, reflecting a cautious market sentiment. The US Dollar Index (DXY) is currently showing a lack of clear direction below the psychological resistance level of 100.00. The USD Index is attempting to recover after a significant sell-off. The decline in US inflation and easing labor market conditions have been contributing factors to the weaker performance of the USD Index. The upcoming release of the monthly Retail Sales data for June, scheduled for Tuesday, will serve as the next key event for the USD Index.
Diagram of NZD/USD: -
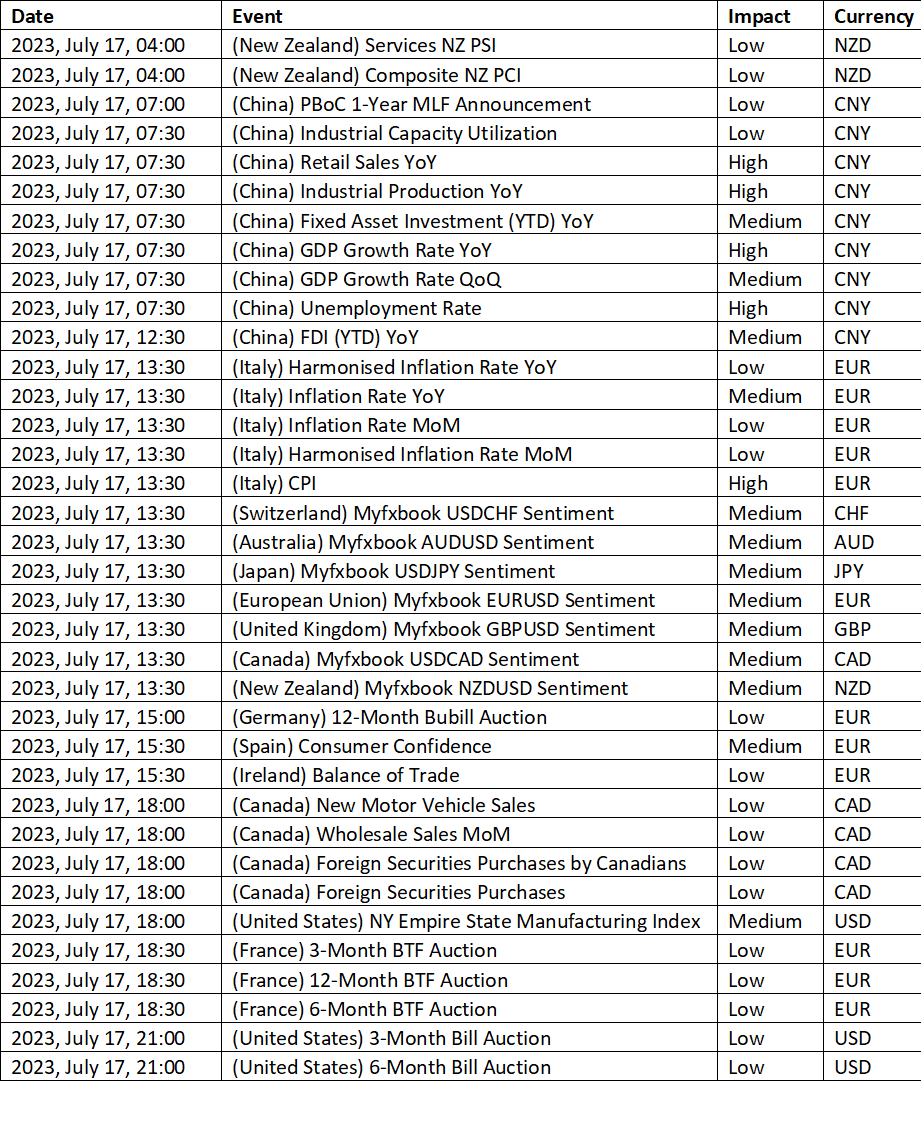
Economic Events: -
Buy Scenario: -
The NZD/USD pair is currently exhibiting a bullish momentum, which may be attributed to the price breaking above a descending resistance line, suggesting a potential bullish movement.
In the event of a bounce from these support levels, the price could face resistance at 0.6414, characterized by overlap resistance. If the price manages to surpass this level, the next resistance at 0.6510 could present a challenge. This level represents a resistance formed by previous swing highs and could have a significant impact on the future direction of the pair. Till we do not advise to buy NZD/USD.
Sell Scenario: -
There is a possibility of a short-term drop towards the 1st support level before a rebound takes place, driving the price towards the 1st resistance. The 1st support level at 0.6305 is supported by a pullback support, a 23.60% Fibonacci retracement, and a 61.80% Fibonacci projection, indicating a significant Fibonacci confluence. If the price falls below this level, the 2nd support at 0.6237 may provide additional support. This level is also a pullback support and exhibits a Fibonacci confluence with a 50% Fibonacci retracement and a 100% Fibonacci extension. Till we do not advise to sell NZD/USD.
Support and Resistance Level: -
Support Resistance
S1 0.6351 - R1 0.6400
S2 0.6333 - R2 0.6431
S3 0.6302 - R3 0.6449


Discussion