

NZD/USD Price Analysis: Bulls Aim for Break of Trendline Resistance- 18-07-2023.
NZD/USD Analysis
Key Points: -
- During the Asian session on Tuesday, the NZD/USD pair slightly increases in value, although it lacks strong follow-through.
- The US Dollar (USD) is being undermined by speculations that the Federal Reserve (Fed) will soon conclude its cycle of interest rate hikes, which has provided support to the New Zealand Dollar (NZD).
- Furthermore, the positive risk sentiment prevailing in the market contributes to the weakening of the safe-haven status of the US Dollar.
Today's Scenario: -
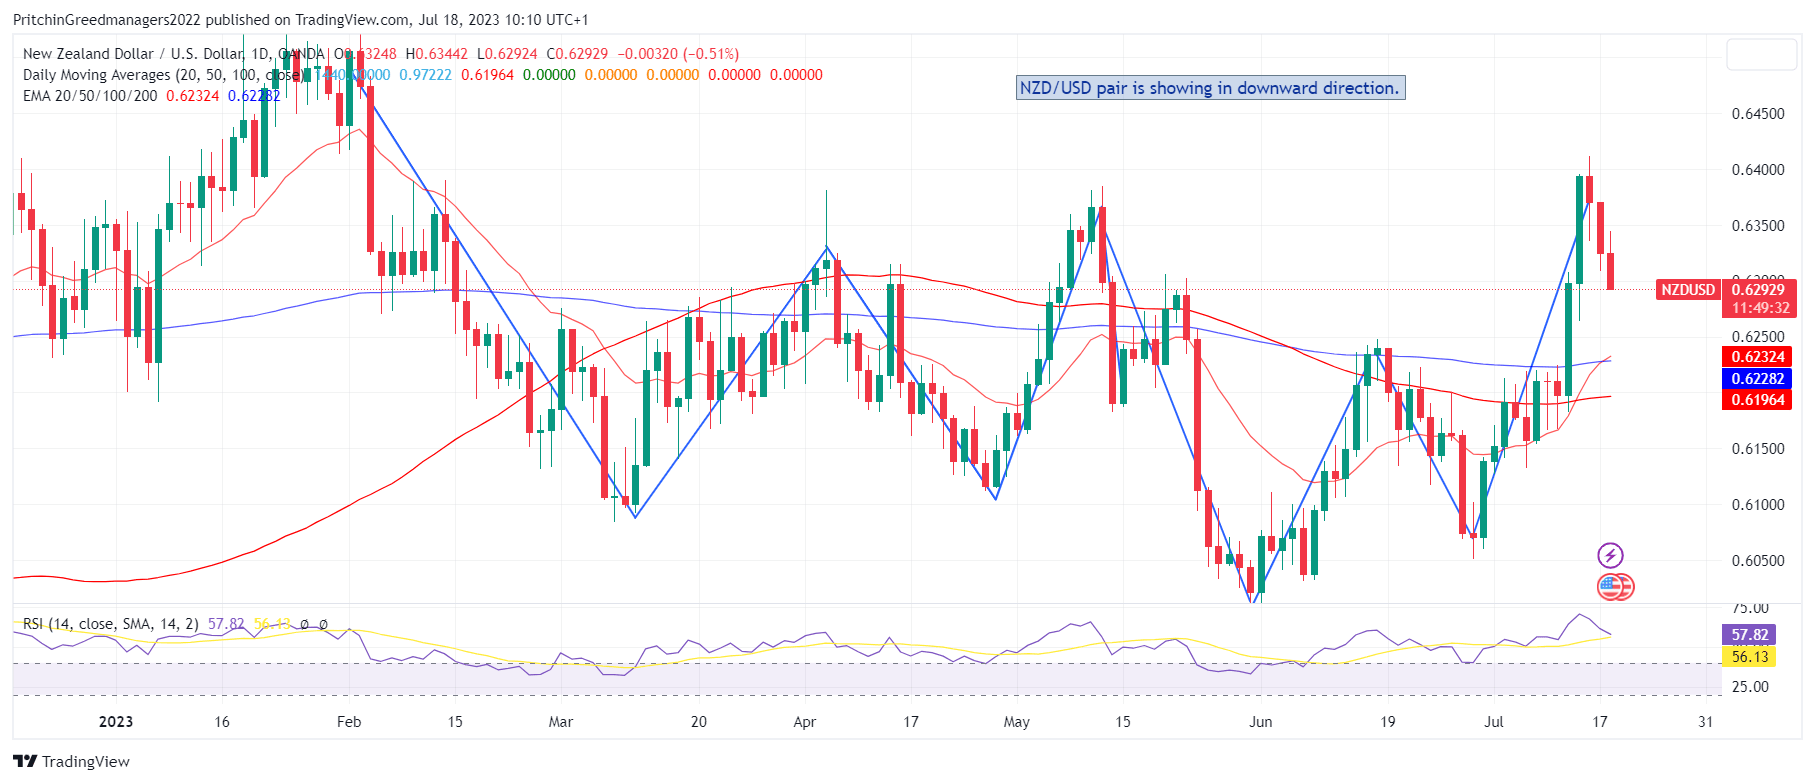
The NZD/USD pair successfully defends the 0.6300 level and experiences some buying pressure during the Asian session on Tuesday. It has halted its retracement from levels above the 0.6400 round figure, which was the highest since early February last week. The current spot prices are trading just below the mid-0.6200s, showing an increase of nearly 0.30% for the day. The pair is receiving support from a slight decline in the US Dollar (USD).
The USD Index (DXY), which measures the Greenback against a basket of currencies, remains close to a 15-month low reached last Friday. It continues to be weakened by growing expectations of a less hawkish stance from the Federal Reserve (Fed). Investors now believe that the US central bank is nearing the end of its tightening cycle and have reduced the likelihood of any further interest rate hikes this year, following the anticipated 25 basis points increase in July. This has led to a recent decline in US Treasury bond yields and puts USD bulls on the defensive.
Additionally, the overall positive risk sentiment in the market is weighing on the safe-haven status of the USD and providing some support to the risk-sensitive New Zealand Dollar (NZD). However, the weaker Chinese GDP figures released on Monday have raised concerns about a global economic slowdown, which may limit optimism in the markets. Furthermore, the expectation that the Fed may adhere to its forecast of a 50 basis points rate hike this year could prevent traders from taking aggressive bearish positions on the USD. Consequently, any significant upward movement for the NZD/USD pair may be limited.
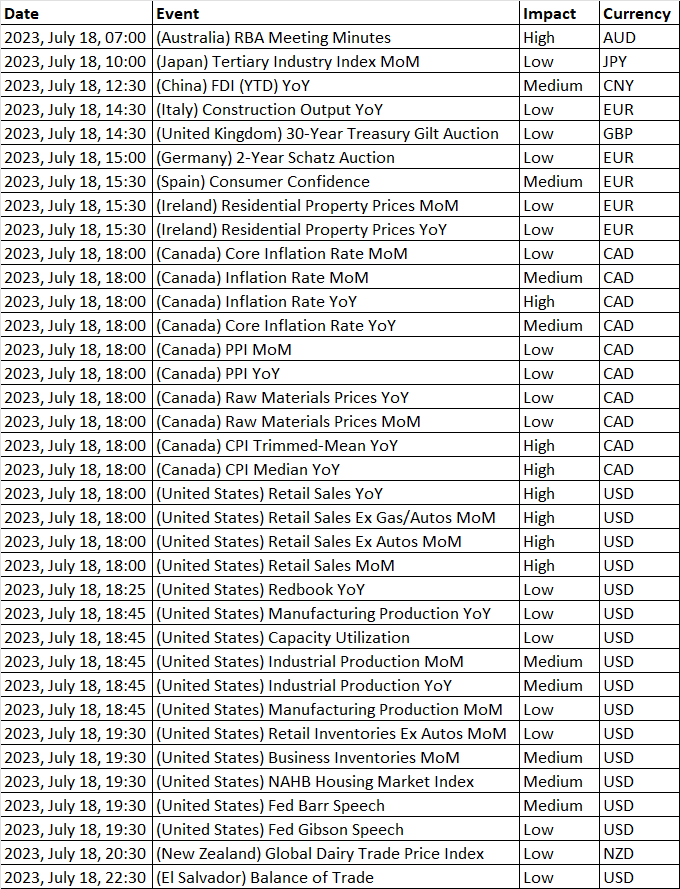
Market participants are now focusing on the US economic calendar, which includes the release of monthly Retail Sales and Industrial Production data during the early North American session. These releases, along with US bond yields and overall risk sentiment, may influence the USD and provide some momentum for the NZD/USD pair. Considering the current fundamental backdrop, it would be prudent to await further buying activity before confirming that the recent pullback from multi-month highs has concluded, and considering new bullish positions on the pair.
Diagram of NZD/USD: -
Economic Events: -
Buy Scenario: -
On the upside, the 1st resistance level is positioned at 0.6410, characterized by swing high resistance. This level could act as an obstacle, resulting in selling pressure. If the price manages to surpass this resistance, it may target the 2nd resistance level at 0.6456, known as a pullback resistance. Till we do not advise to buy NZD/USD.
Sell Scenario: -
The NZD/USD pair currently demonstrates a bullish trend. In this scenario, it has the potential to experience a bullish rebound from the 1st support level and proceed towards the 1st resistance level.
The 1st support level is located at 0.6317, which is identified as an overlap support and coincides with the 38.20% Fibonacci retracement level. If the price retraces to this level, there is likely to be a significant amount of buying interest, which could propel the price higher. However, if the 1st support level is breached, the price may further decline towards the 2nd support level at 0.6240. This level is recognized as a pullback support and aligns with the 50% Fibonacci retracement level. Till we do not advise to sell NZD/USD.
Support and Resistance Level: -
Support Resistance
S1 0.6298 - R1 0.6360
S2 0.6272 - R2 0.6396
S3 0.6236 - R3 0.6422


Discussion