

Gold Price Forecast: XAU/USD Upside Potential Amid US Data Anticipation- 18-07-2023
Gold (XAU/USD) Analysis
Key Points: -
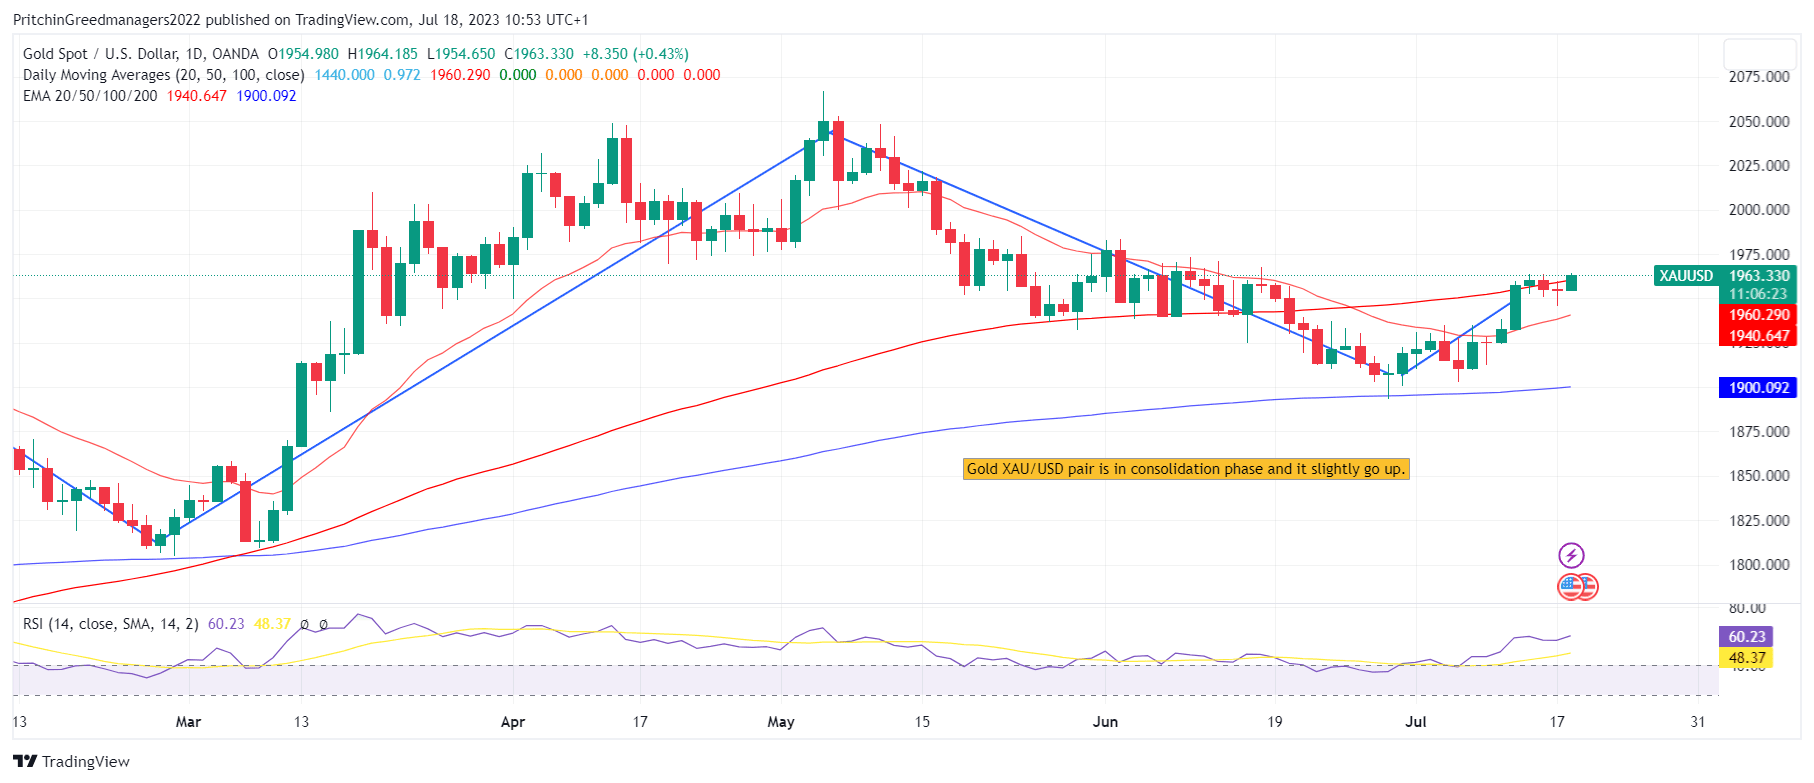
- The price of gold has shown upward movement, surpassing important resistance levels in the short term and ending a three-day downtrend.
- Positive sentiment in the market is supported by news related to China, contributing to the rise in XAU/USD (gold price in relation to the US dollar).
- The short-term movements of the gold price could be influenced by upcoming events such as US Retail Sales and Industrial Production data, which will provide guidance before the Federal Reserve (Fed) meeting in July.
Today's Scenario: -
The price of gold (XAU/USD) is benefiting from the resurgence of a risk-on sentiment among traders who are reevaluating previous concerns surrounding China. Furthermore, the US Dollar's inability to sustain its recovery from late Friday, coupled with lackluster data, has added strength to the sentiment and supported the price of XAU/USD, pushing it towards reclaiming the $2,000 mark.
In addition to the new factors indicating China's ability to defend its economic growth, headlines suggesting an improvement in US-China relations are also contributing to cautious optimism in the market. Furthermore, despite the positive consumer-centric figures observed on Friday, the US NY Empire State Manufacturing Index failed to inspire confidence among US Dollar bulls.
Moreover, the expectation of further stimulus measures from China and challenges for restrictive monetary policies are also supporting the firmer stance of the gold price.
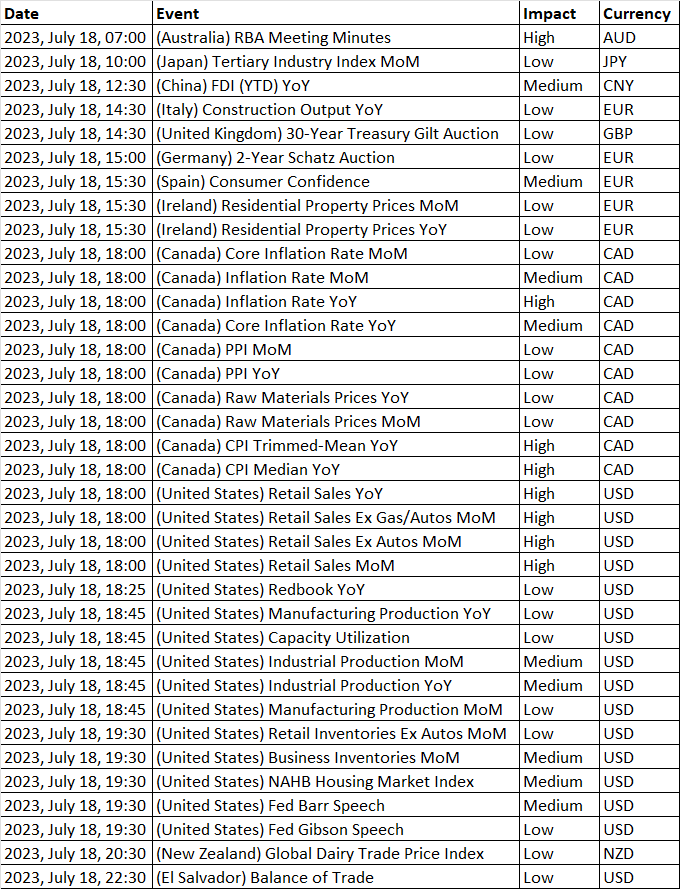
Looking ahead, the US Retail Sales and Industrial Production data for June will play a crucial role in shaping the Federal Reserve's rate hike trajectory beyond July. These data releases will also provide insights into the potential movements of the gold price.
Diagram of XAU/USD (Gold): -
Economic Events: -
Buy Scenario: -
According to our Technical Confluence Indicator, the Gold Price has recently surpassed significant resistance levels, indicating a smoother path towards the upside compared to potential obstacles in other directions.
Currently, there is a convergence of the previous weekly high and the upper band of the Bollinger on the four-hour chart, which signifies immediate resistance around the $1,965 mark.
Subsequently, the Pivot Point one-month R1 level could act as a catalyst for XAU/USD bulls around $1,975 before guiding them towards the resistance confluence at $1,985, which includes the previous monthly high. Till we did not advise to buy XAU/USD.
Selling Scenario: -
On the downside, the Gold Price faces immediate support near the 50-day moving average (DMA) level, which is approximately $1,951.
Close to that level, there is a convergence of the Fibonacci 61.8% on the one-month timeframe and the 23.6% on the one-day timeframe, located near $1,950.
It's important to note that the XAU/USD bulls have their final line of defense around the Fibonacci 38.2% on the one-week chart, situated near $1,945. We do not advise selling XAU/USD.
Support and Resistance Level: -
Support Resistance
S1 1947.34 - R1 1961.41
S2 1939.56 - R2 1967.70
S3 1933.27 - R3 1975.48


Discussion