

Gold Price Forecast: XAU/USD Pulls Back from $1,985 Resistance, Yield Impact Assessed- 19-07-2023
Gold (XAU/USD) Analysis
Key Points: -
- The price of gold retreats from its two-month high as it fails to surpass a key resistance level.
- Mixed market sentiment and positive US data contribute to the consolidation of the US Dollar, which has recently reached a multi-month low.
- Developments in China and concerns regarding the Federal Reserve's actions impact Treasury bond yields and the price of gold (XAU/USD).
- Market participants will closely monitor risk catalysts for clearer market directions, considering the light economic calendar.
Today's Scenario: -
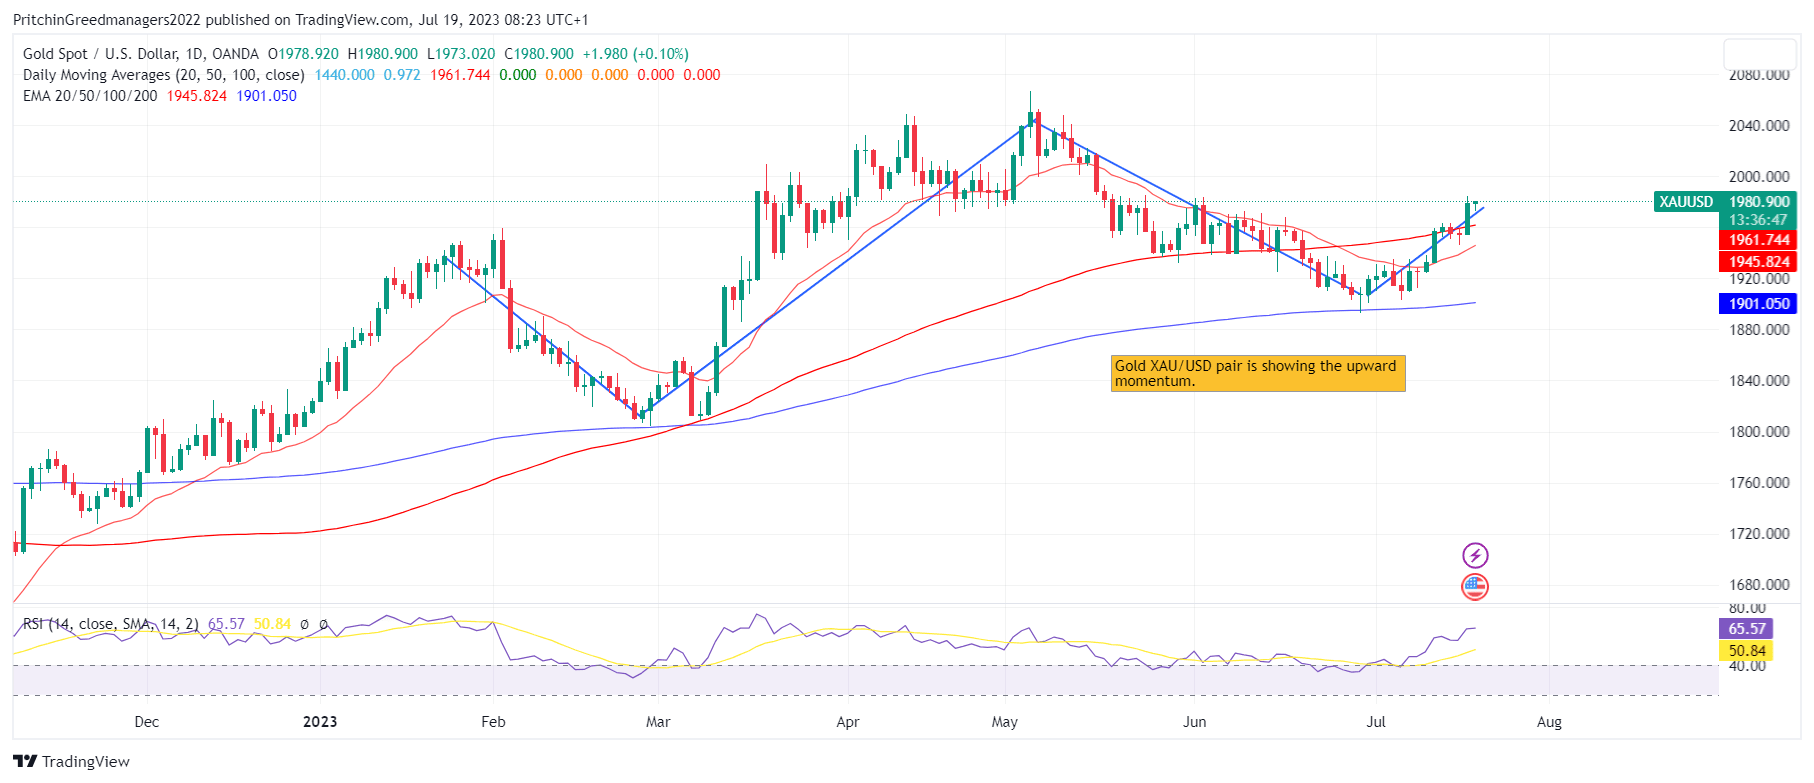
The price of gold (XAU/USD) is currently under pressure, trading near its intraday low as it retraces from its highest levels in eight weeks. This downward movement is primarily driven by the US Dollar's sustained recovery from a 15-month low. Additionally, negative risk headlines from China are also contributing to the downside pressure on the XAU/USD price. It is important to note that despite the decline in US Treasury bond yields, gold prices are not experiencing significant upside momentum, as market participants await further clues to determine the direction of market sentiment.
The sentiment improved in the previous day as US banks anticipated higher profits from higher interest rates. However, concerns about the Federal Reserve's potential policy pivot after the expected 0.25% rate increase in July have created a favorable mood and supported the XAU/USD price. Nonetheless, the positive details of the US Retail Sales report and the expectation that the Fed will maintain higher interest rates for a longer period, if not announce multiple rate hikes, have recently exerted downward pressure on the price of gold.
In addition, the China Industry Ministry recently expressed concerns about insufficient demand and declining revenues, which aligns with the downbeat Gross Domestic Product (GDP) data for the second quarter (Q2). This data has raised fears of a slowing economic recovery in the world's largest industrial player. Considering China's significant role as one of the largest consumers of oil, these economic concerns have weighed on commodity prices, including gold.
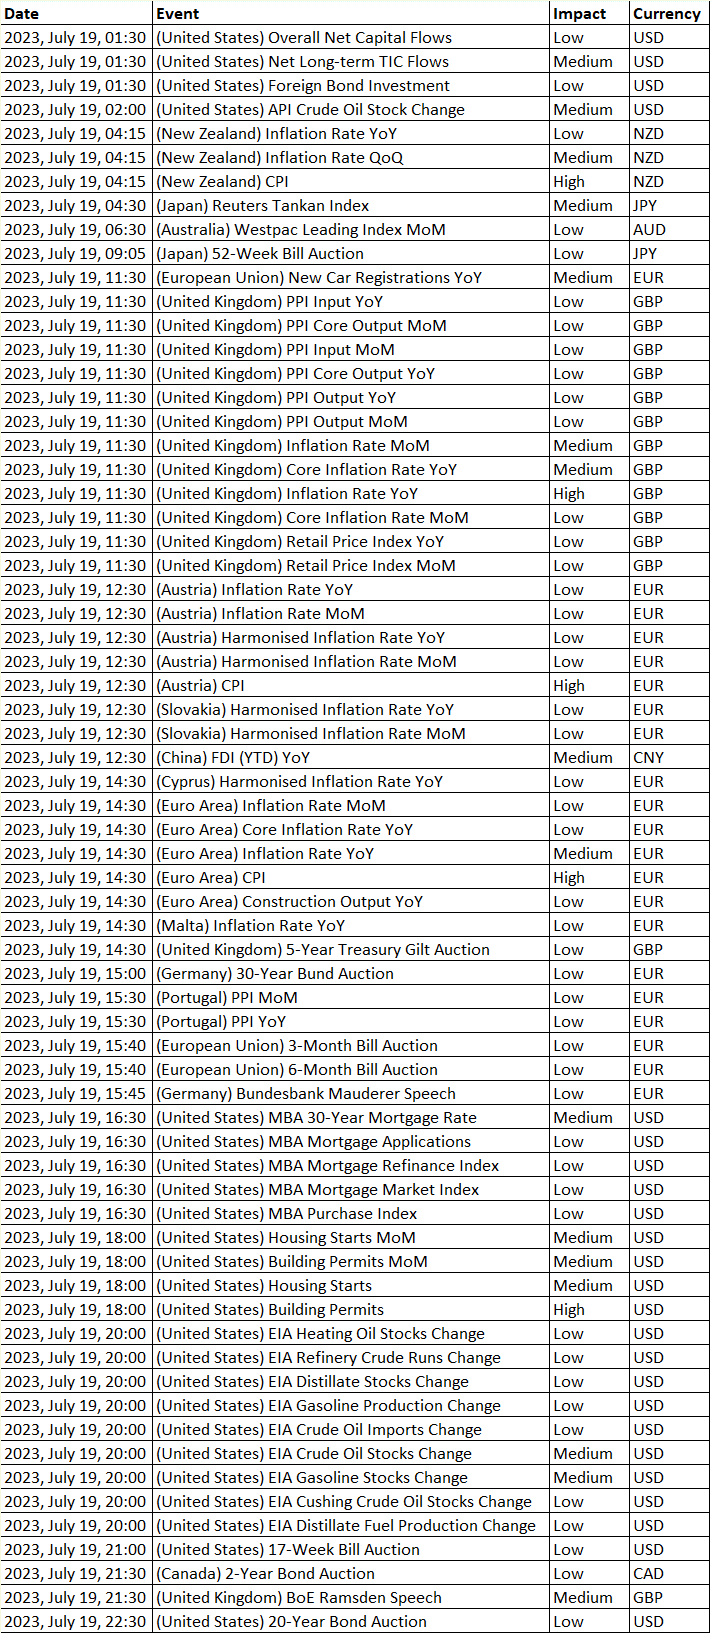
Looking ahead, market participants in XAU/USD trading will closely monitor risk catalysts as the economic calendar remains light. The cautious mood prevails as market participants prepare for the Federal Open Market Committee (FOMC) monetary policy meeting scheduled for the following week. These events and developments will likely influence gold prices in the near term.
Diagram of XAU/USD (Gold): -
Economic Events: -
Buy Scenario: -
According to our Technical Confluence indicator, the price of gold has moved lower, breaking through the resistance confluence at $1,985, which includes the previous daily and monthly highs.
The XAU/USD bulls face additional challenges, including the Pivot Point one-week R1 at around $1,998, followed closely by the psychological level of $2,000.
If the gold price manages to remain above $2,000, there is a possibility of a further upward move towards April's peak at around $2,050. Till we did not advise to buy XAU/USD.
Selling Scenario: -
On the downside, immediate support for the bears to watch for confirmation is highlighted by the Pivot Point one-month R1 at $1,970.
Further support levels include the 5-day SMA, Pivot Point one-month S1, and the middle band of the Bollinger on the four-hour chart, all around $1,961, which may attract gold sellers.
It is important to note that the Fibonacci 23.6% on the one-week and one-day timeframes, located at approximately $1,950, represents the last line of defense for gold buyers. A break below this level would give control to the XAU/USD bears. We do not advise selling XAU/USD.
Support and Resistance Level: -
Support Resistance
S1 1960.68 - R1 1990.64
S2 1942.59 - R2 2002.51
S3 1930.72 - R3 2020.60


Discussion