
GBP/USD Price Analysis: Cable Aims to Reclaim 1.3000 Amid Bullish Technicals - 20-07-2023
GBP/USD Analysis
Key Points: -
- The GBP/USD pair stays neutral, hovering around 1.2935, following a drop to a weekly low below the 1.2900 level.
- The UK's June Consumer Price Index (CPI) indicated a moderation in inflationary pressures.
- Despite disappointing US housing data, the US Dollar rebounds and reaches five-day highs.
Today's Scenario: -
The GBP/USD pair is trading around 1.2935 in the early Asian session, recovering slightly from its weekly low near the 1.2870 region. The decline was triggered by the release of softer UK Consumer Price Index (CPI) data.
According to the Office for National Statistics in the United Kingdom, the headline CPI increased by only 0.1% in June on a monthly basis, which was below the market expectation of 0.4% and lower than the 0.9% increase in May. On an annual basis, the headline CPI fell to 7.9%, falling short of the market consensus of 8.2% and the 8.7% increase in May. The core CPI, which excludes volatile food and oil prices, also showed a decrease to 6.9%, compared to the market expectation of 7.1%. This softer inflation data might lead the Bank of England (BoE) to consider a smaller rate hike of 25 basis points (bps) rather than 50 bps in the upcoming policy meeting on August 3.
On the other hand, in the US, Housing Starts declined by 8% in June, following a 15.7% gain (revised from +21.7%) in May. Building permits also dropped by 3.7% in June, compared to the previous increase of 5.6% (revised).
Despite the disappointing US housing data, the US Dollar rebounded to five-day highs, hovering around 100.25 on Thursday. Market participants believe that the Federal Reserve (Fed) is nearing the end of its policy tightening cycle and will likely maintain interest rates after the widely expected 25 basis points (bps) rate hike in the July meeting.
Looking ahead, investors will closely monitor the US Existing Home Sales and the UK Retail Sales data for fresh market direction. Next week, the focus will shift to the Flash Manufacturing Purchasing Managers Index (PMI) and Flash Services PMI from the US and UK, which could have a significant impact on the GBP/USD pair and help determine its next direction.
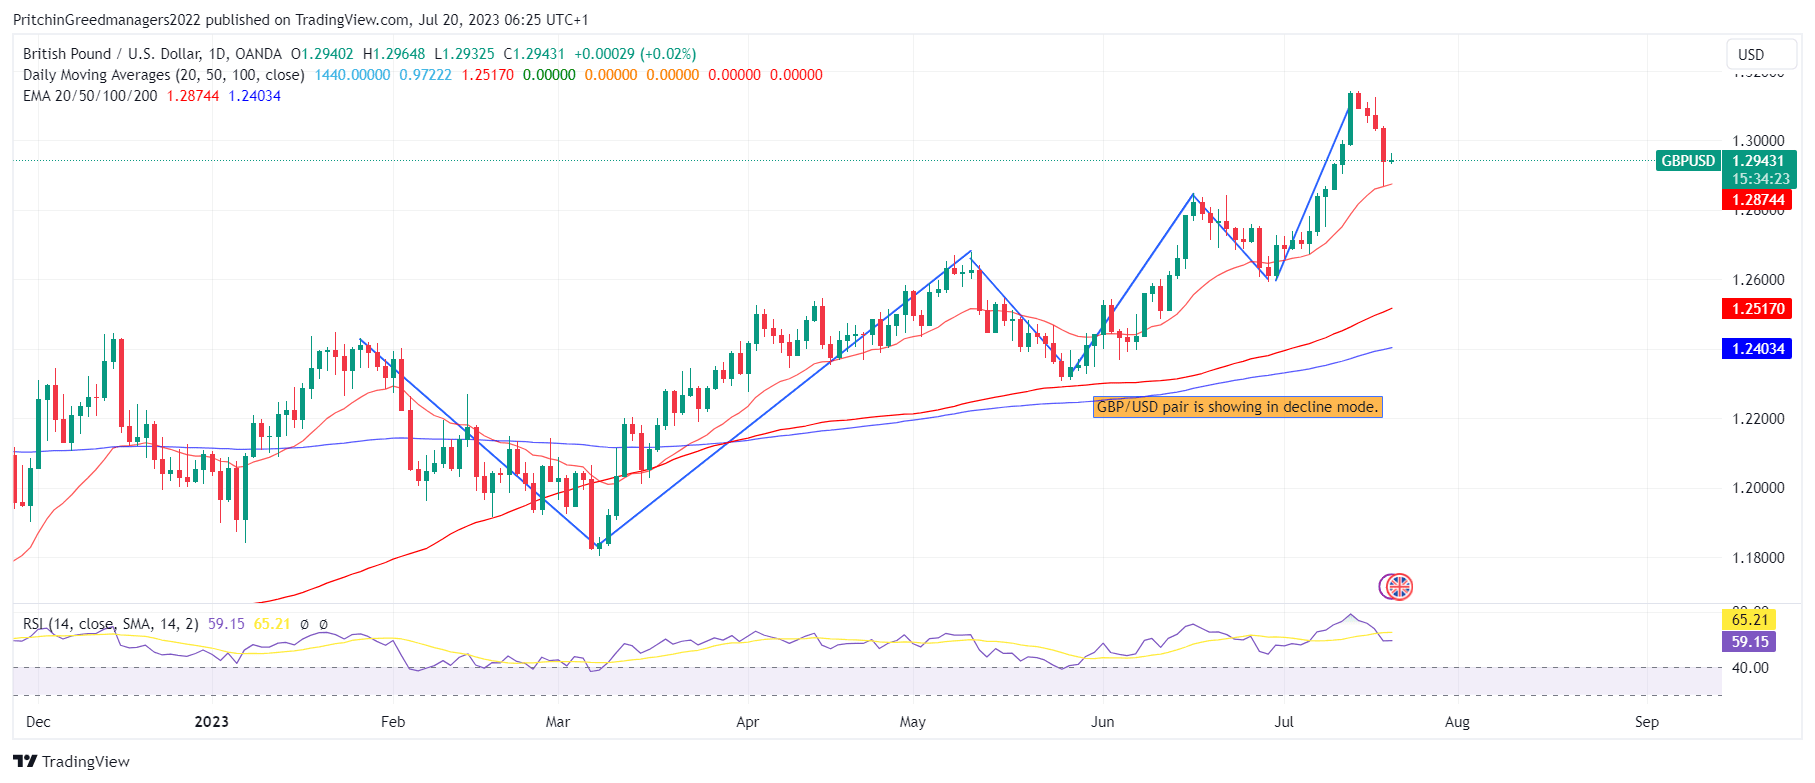
Diagram of GBP/USD: -
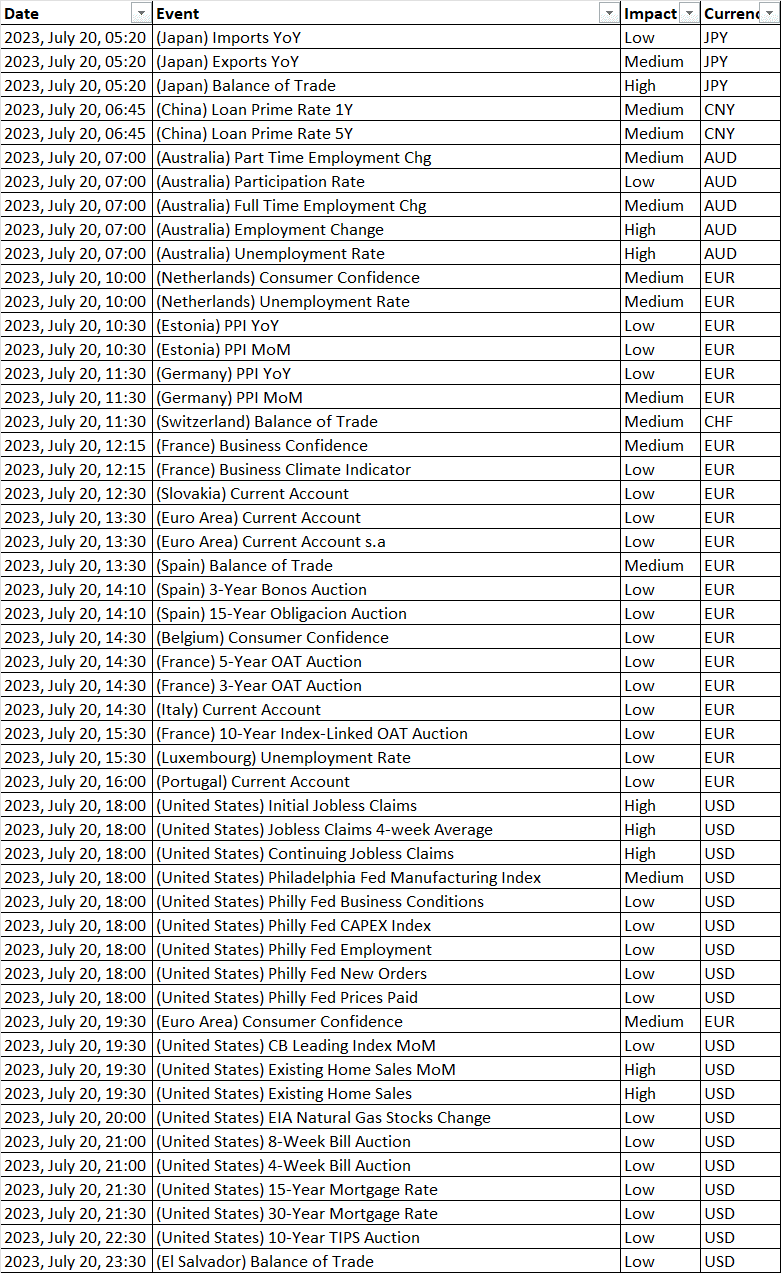
Economic Events: -
Buy Scenario: -
GBP/USD is trading on a positive note around the intraday high of approximately 1.2965 in early Thursday morning in London. The pair has broken its four-day downtrend and bounced back from the lowest levels seen in the past seven days. This price action is supported by multiple technical signals that favor a bullish bias for the Pound Sterling.
One significant signal is Wednesday's bullish Doji candlestick pattern formed at the weekly low. This pattern coincides with the convergence of the 100-bar Exponential Moving Average (EMA) and a rising support line that has been in place for three weeks. Additionally, the Relative Strength Index (RSI) line has rebounded from the oversold region, providing further strength to the upside bias.
Given these technical factors, GBP/USD appears to be well-positioned to reclaim the 1.3000 psychological level. However, there might be some resistance around the 1.3045-1.3050 area, which includes previous lows marked during mid-July.
If the pair manages to stay above 1.3050, there is a possibility of further upward movement towards the monthly high of 1.3142. Till we do not advise to buy GBP/USD.
Sell Scenario: -
On the other hand, a successful break below the support confluence around 1.2895-1.2890, which includes the rising support line and the 100-EMA, could attract intraday sellers. However, such a move may not immediately indicate a bearish trend, as another support area lies near 1.2850, which has been significant for the past five weeks.
In case of further downward movement, the final defense for GBP/USD bulls can be found around the 200-EMA level at approximately 1.2780.
Overall, the technical indicators are suggesting a bullish bias for GBP/USD, but traders should closely monitor the key support and resistance levels mentioned above to gauge the market's future direction accurately. Till then we do not advise selling GBP/USD.
Support and Resistance Level: -
Support Resistance
S1 1.2857 - R1 1.3034
S2 1.2774 - R2 1.3127
S3 1.2680 - R3 1.3210


Discussion