

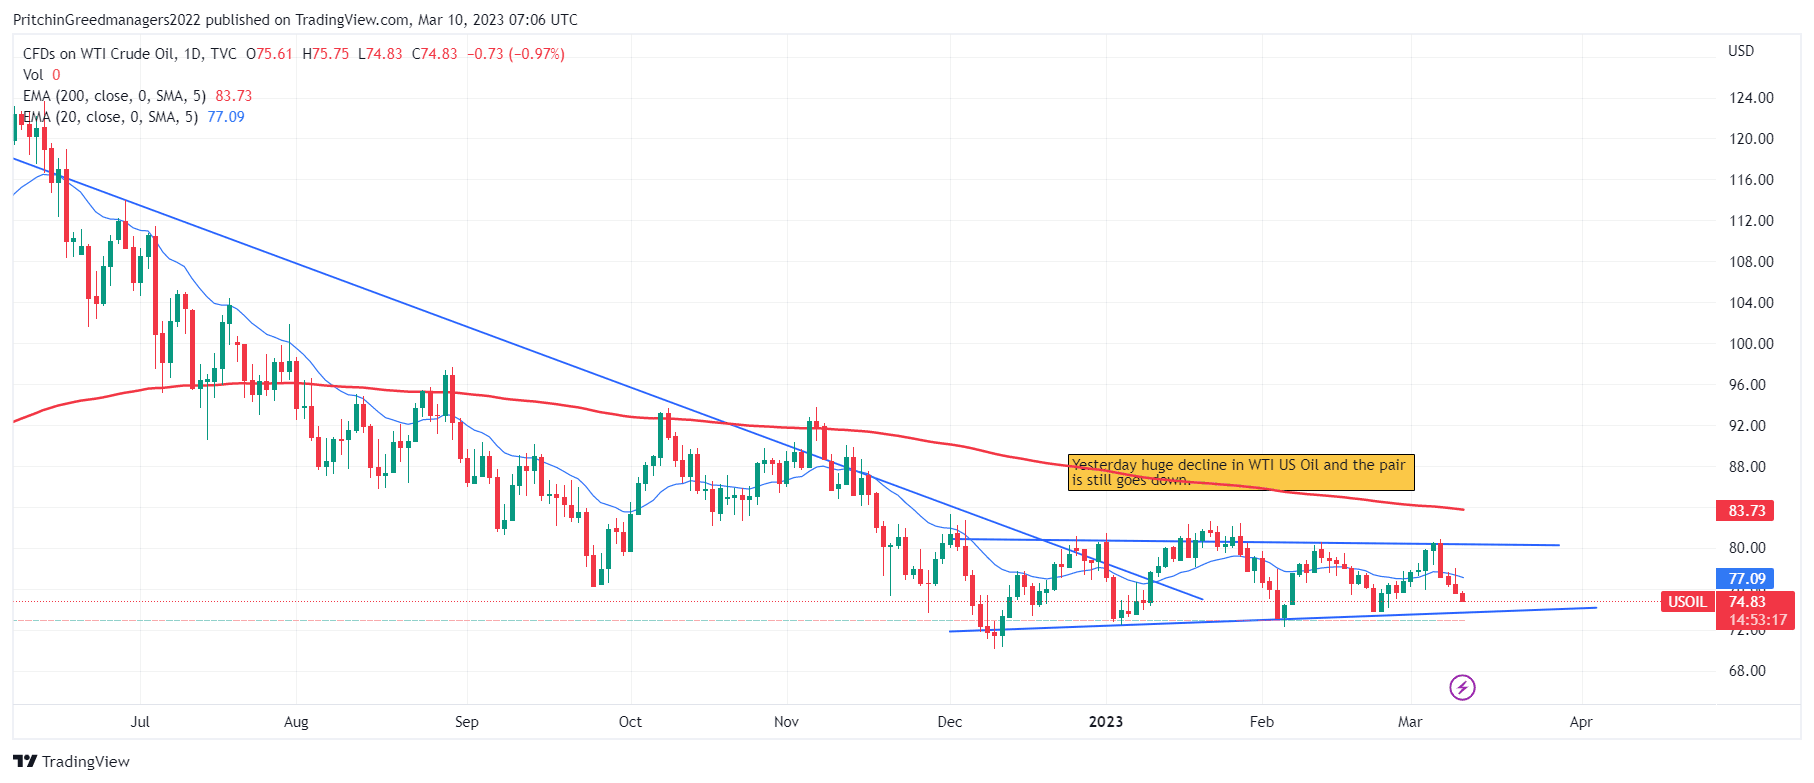
Daily Analysis For WTI Crude (US Oil) 10-03-2023
| GMT | Event | Currency | |
|---|---|---|---|
| 13:30 | - | (United States) Average Hourly Earnings MoM | USD |
| 13:30 | - | (United States) Nonfarm Payrolls Private | USD |
| 13:30 | - | (United States) Non Farm Payrolls | USD |
| 13:30 | - | (United States) Unemployment Rate | USD |
| 13:30 | - | (United States) Participation Rate | USD |
| 13:30 | - | (United States) Average Hourly Earnings YoY | USD |
| 19:00 | - | (United States) Monthly Budget Statement | USD |
| Support | Resistance | ||
|---|---|---|---|
| S1 92.93 | - | R1 105.59 | |
| S2 90.06 | - | R2 108.75 | |
| S3 85.41 | - | R3 116.64 |


Discussion