Daily Analysis For US Doller Index 12-06-2023
US Doller Index Analysis
Key Points: -
· The US Dollar Index (DXY) has managed to hold onto its corrective bounce from Friday but struggles to gain momentum following a two-week downtrend. The index, which measures the value of the US dollar against a basket of major currencies, faces pressure as market participants reassess their expectations regarding the Federal Reserve's monetary policy decisions and look for clues regarding inflation.
· DXY bears are cautious ahead of top-tier data releases and events that could provide further insight into the market's bets on the likelihood of a rate hike by the Federal Reserve in June. One key data point to watch is the US Consumer Price Index (CPI), which will play a crucial role in confirming or challenging the market's expectations.
· The market sentiment towards the US dollar will largely depend on the outcome of the CPI data and its implications for the Fed's future policy decisions. If the data aligns with the market's expectations of no rate hike in June, it could keep the DXY bears in control. On the other hand, any surprises or indications of higher inflation could prompt a reassessment of the Fed's stance and potentially support the US dollar.
Today's Scenario: -
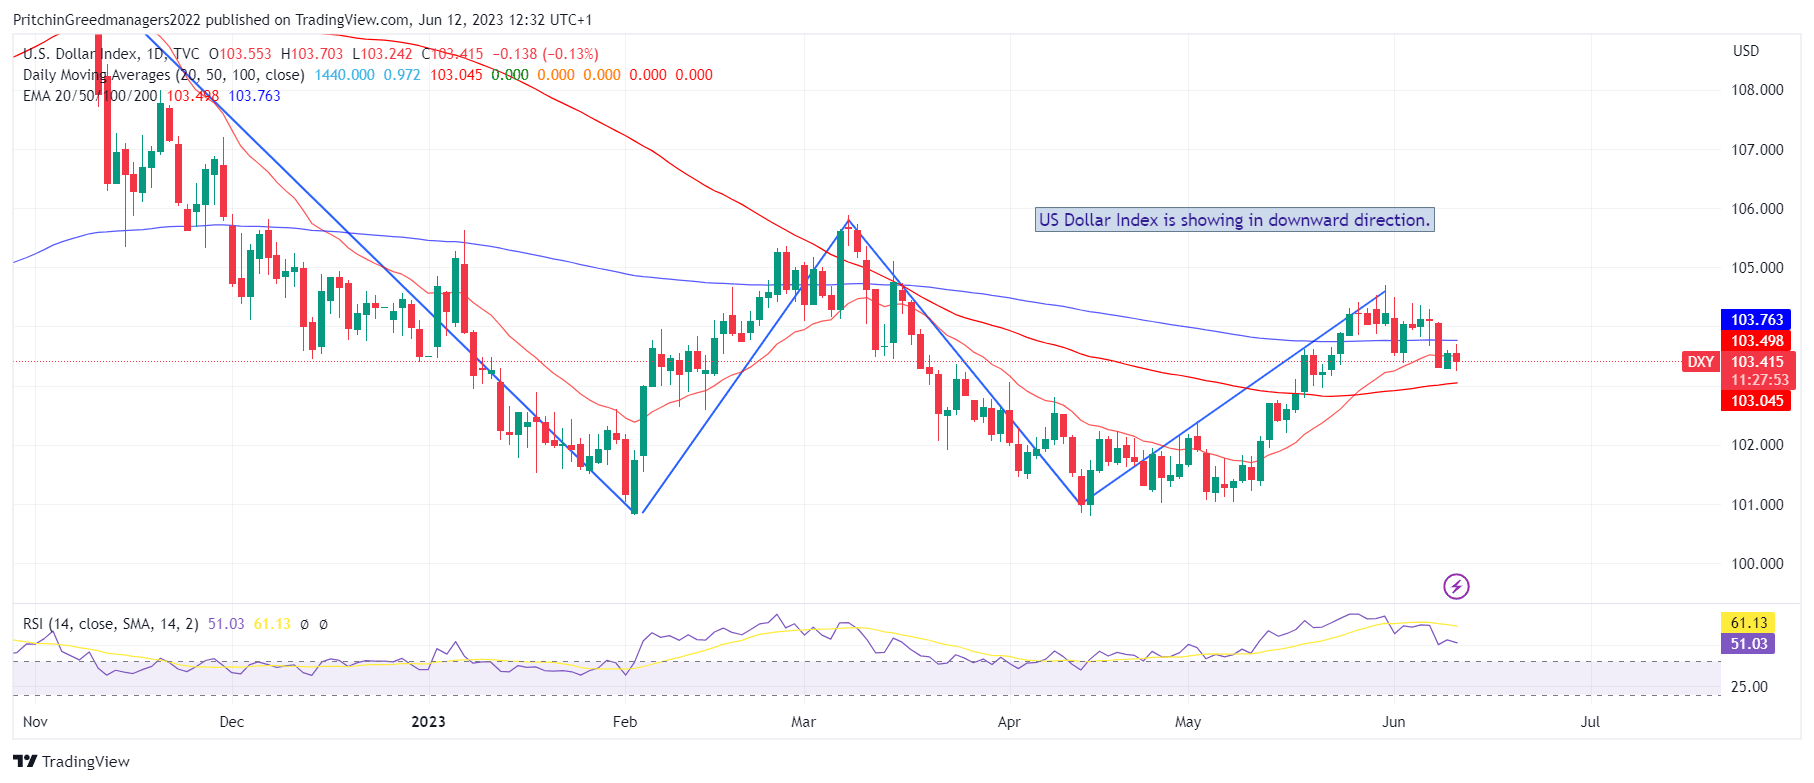
The US Dollar Index (DXY), which measures the value of the US Dollar against a basket of six major currencies, has continued its rally for four consecutive days. It has moved further away from the 200-day Exponential Moving Average (EMA) level, which was reached on May 24 at 103.743. The recent strength of the index has been supported by high US Treasury bond yields. As of the time of writing, the DXY is trading at 104.211, showing a gain of 0.31%. Bullish investors are now targeting the 105.000 level.
Diagram of US Dollar Index (DXY): -

Economic Events : -
Date Event Impact Currency
4:15 (New Zealand) Electronic Retail Card Spending YoY Low NZD
4:15 (New Zealand) Electronic Retail Card Spending MoM Low NZD
5:20 (Japan) PPI YoY Low JPY
5:20 (Japan) PPI MoM Low JPY
5:31 (Ireland) Construction PMI Low EUR
10:30 (Finland) Current Account Low EUR
11:30 (Japan) Machine Tool Orders YoY Low JPY
12:30 (Slovakia) Construction Output YoY Low EUR
13:30 (China) Total Social Financing Low CNY
13:30 (China) New Yuan Loans Low CNY
13:30 (China) M2 Money Supply YoY Low CNY
13:30 (China) Outstanding Loan Growth YoY Low CNY
13:30 (Switzerland) Myfxbook USDCHF Sentiment Medium CHF
13:30 (Australia) Myfxbook AUDUSD Sentiment Medium AUD
13:30 (Japan) Myfxbook USDJPY Sentiment Medium JPY
13:30 (European Union) Myfxbook EURUSD Sentiment Medium EUR
13:30 (United Kingdom) Myfxbook GBPUSD Sentiment Medium GBP
13:30 (Canada) Myfxbook USDCAD Sentiment Medium CAD
13:30 (New Zealand) Myfxbook NZDUSD Sentiment Medium NZD
15:15 (European Union) EU Bond Auction Low EUR
15:15 (European Union) 15-Year Bond Auction Low EUR
18:30 (Ecuador) Balance of Trade Low USD
18:30 (France) 3-Month BTF Auction Low EUR
18:30 (France) 12-Month BTF Auction Low EUR
18:30 (France) 6-Month BTF Auction Low EUR
20:30 (Kosovo) Inflation Rate YoY Low EUR
20:30 (United States) Consumer Inflation Expectations Low USD
21:00 (United States) 6-Month Bill Auction Low USD
21:00 (United States) 3-Year Note Auction Low USD
22:30 (United States) 3-Month Bill Auction Low USD
22:30 (United States) 10-Year Note Auction Low USD
23:30 (United States) Monthly Budget Statement Medium USD
Buy Scenario: -
On the upside, if there is a significant upward move, there is a cluster of resistance levels between 105.82 and 105.36. This resistance zone includes a trendline resistance drawn from the high at 114.78, the 200-day simple moving average positioned at 105.45, and two Fibonacci retracement ratios (38.2% and 61.8%) at 105.54 and 105.25, respectively.
These technical levels provide important reference points for traders and investors to monitor as they can act as potential barriers or triggers for further price movement. Till we do not advise to buy US Dollar Index.
Sell Scenario: -
From a technical standpoint, there are two key areas to watch for the US Dollar Index (DXY) this week. On the downside, there is the 50-day simple moving average located at 102.51, which serves as a dynamic level of support. Additionally, there is local support at 102.26, further reinforcing the significance of this area. Till we do not advise to sell in US Dollar Index
Support and Resistance Level: -
Support Resistance
S1 103.36 - R1 103.67
S2 103.17 - R2 103.80
S3 103.05 - R3 103.99


Discussion