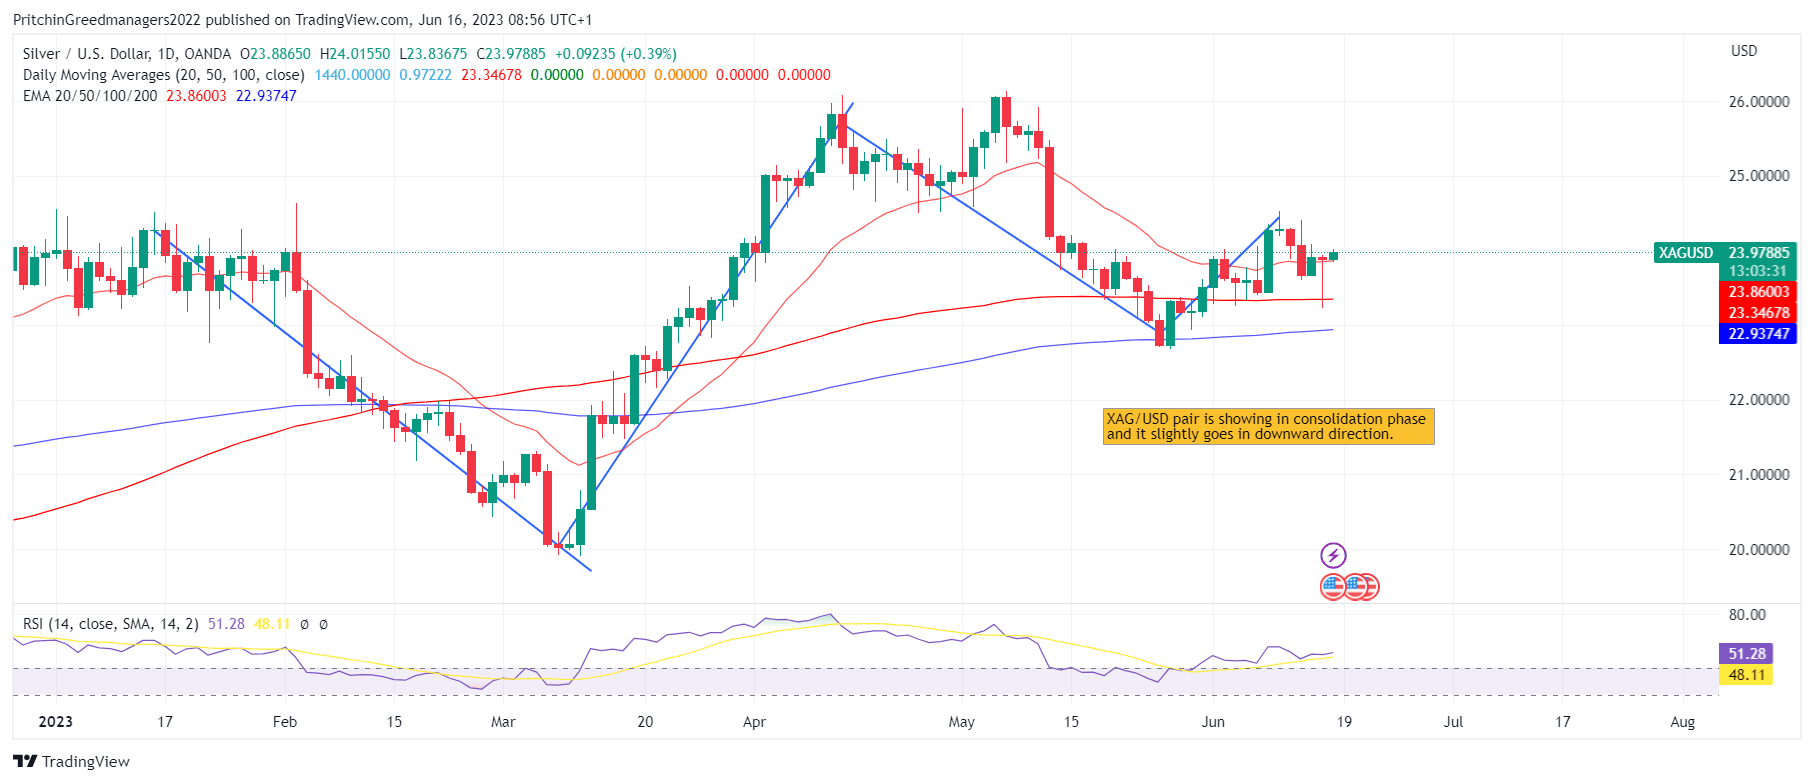
Daily Analysis For Silver (XAG/USD) 16-06-2023
Sliver (XAG/USD) Analysis
Key Points: -
· Silver price is seeking to break above the $24.00 level, taking advantage of the decline in the USD Index.
· The recent improvement in the US labor market suggests that the Federal Reserve might maintain its stance of not raising interest rates in July as well.
· The breakdown of the Retail Sales report reveals strong demand for automobiles and building materials, indicating robust consumer activity in those sectors.
Today's Scenario: -
Silver price (XAG/USD) is currently attempting to break above the key resistance level of $24.00 during the European session. The white metal is gaining strength as the US Dollar Index (DXY) is expected to resume its downward movement and fall below the 102.00 level.
The USD index has retreated after a hesitant recovery to around 102.29, as the ongoing improvement in labor market conditions in the United States suggests that the Federal Reserve (Fed) may continue to hold off on raising interest rates in its upcoming July monetary policy meeting.
On Tuesday, the US Department of Labor reported that initial jobless claims remained higher than expected for the fourth consecutive week. For the week ending June 09, jobless claims came in at 262K, unchanged from the previous release, while the market was anticipating a decline to 249K.
Despite positive monthly Retail Sales data, the US Dollar bulls failed to gain strength. The breakdown of the Retail Sales report revealed robust demand for automobiles and building materials. The data showed a surprising expansion of 0.3%, contrary to the market's expectation of a contraction of 0.1%, but the pace of growth slowed compared to the previous reading of 0.4%.
Meanwhile, S&P500 futures have fully recovered their previous losses as they enter the London session, reflecting an overall positive market sentiment.
Diagram of XAG/USD (Silver): -

Economic Events: -
Date Event Impact Currency
01:30 (United States) Foreign Bond Investment Low USD
01:30 (United States) Net Long-term TIC Flows Medium USD
01:30 (United States) Overall Net Capital Flows Low USD
04:00 (New Zealand) Business NZ PMI Medium NZD
08:30 (Japan) BoJ Interest Rate Decision High JPY
12:30 (Austria) Inflation Rate MoM Low EUR
12:30 (Austria) Inflation Rate YoY Low EUR
12:30 (Austria) Harmonised Inflation Rate YoY Low EUR
12:30 (Austria) Harmonised Inflation Rate MoM Low EUR
12:30 (Austria) CPI High EUR
12:30 (Slovakia) Harmonised Inflation Rate YoY Low EUR
12:30 (Slovakia) Harmonised Inflation Rate MoM Low EUR
12:30 (United States) Fed Bullard Speech Medium USD
13:30 (European Union) ECOFIN Meeting Medium EUR
13:30 (Italy) Inflation Rate YoY Medium EUR
13:30 (Italy) Harmonised Inflation Rate MoM Low EUR
13:30 (Italy) Harmonised Inflation Rate YoY Low EUR
13:30 (Italy) Inflation Rate MoM Low EUR
13:30 (Italy) CPI High EUR
14:30 (Euro Area) Inflation Rate MoM Low EUR
14:30 (Euro Area) Core Inflation Rate YoY Low EUR
14:30 (Euro Area) Inflation Rate YoY Medium EUR
14:30 (Euro Area) Labour Cost Index YoY Low EUR
14:30 (Euro Area) Wage Growth YoY Low EUR
14:30 (Euro Area) CPI High EUR
14:30 (Malta) Inflation Rate YoY Low EUR
15:30 (Portugal) PPI YoY Low EUR
15:30 (Portugal) PPI MoM Low EUR
17:15 (United States) Fed Waller Speech Medium USD
18:00 (Canada) Foreign Securities Purchases Low CAD
18:00 (Canada) Foreign Securities Purchases by Canadians Low CAD
18:00 (Canada) Wholesale Sales MoM Low CAD
19:30 (United States) Michigan Consumer Sentiment High USD
19:30 (United States) Michigan Inflation Expectations Low USD
19:30 (United States) Michigan Current Conditions Low USD
19:30 (United States) Michigan 5 Year Inflation Expectations Low USD
19:30 (United States) Michigan Consumer Expectations Low USD
22:30 (United States) Baker Hughes Oil Rig Count Low USD
22:30 (United States) Baker Hughes Total Rig Count Low USD
Buy Scenario: -
The price of silver has risen above the 38.2% Fibonacci retracement level, which is calculated from the low of $22.68 on May 26 to the high of $24.53 on June 09. This breakthrough occurred at $23.83 on the hourly chart. Additionally, the 20-period Exponential Moving Average (EMA) at $23.83 is acting as a support level for silver buyers. Till we did not recommend buying Silver (XAG/USD).
Sell Scenario: -
The Relative Strength Index (RSI) with a period of 14 is showing signs of transitioning from the bearish range of 20.00-60.00 into the bullish range. If this shift occurs, it would indicate an increase in upside momentum for silver. Till we do not advise selling silver (XAG/USD).
Support and Resistance Level: -
Support Resistance
S1 23.43 - R1 24.15
S2 22.97 - R2 24.40
S3 22.72 - R3 24.86


Discussion