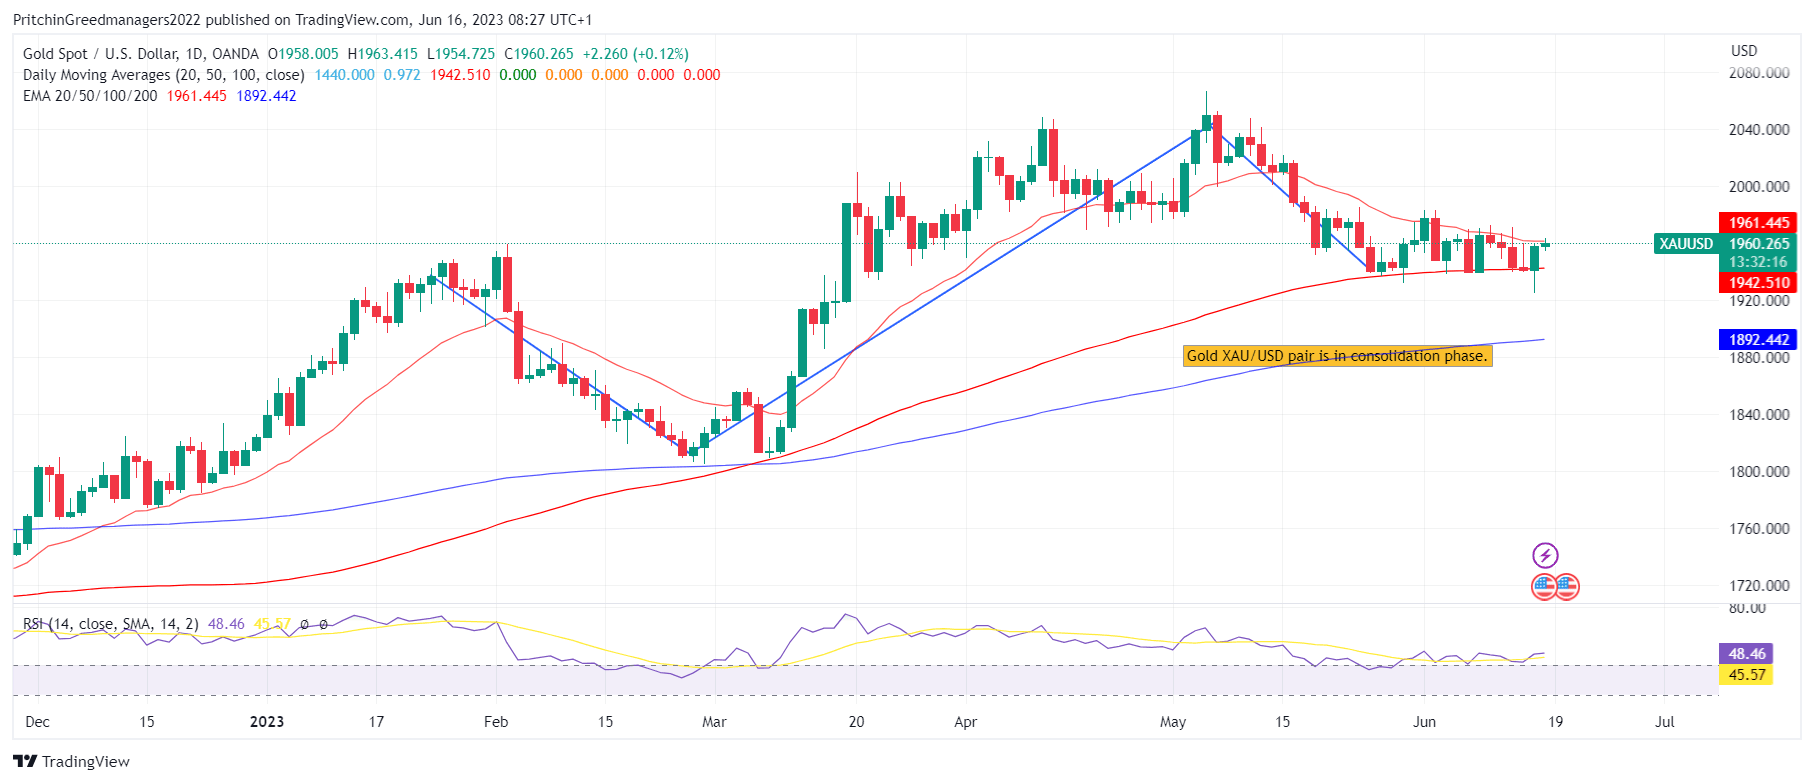
Daily Analysis For GOLD (XAU/USD) 16-06-2023
Gold (XAU/USD) Analysis
Key Points: -
· The price of gold is experiencing a lack of momentum after a temporary rebound from a three-month low.
· Traders of XAU/USD face challenges due to conflicting technical levels and mixed market sentiment.
· Investors are eagerly awaiting further indications to confirm the possibility of a rate hike by the Federal Reserve in July, which could attract gold sellers.
Today's Scenario: -
The price of gold, represented by XAU/USD, is facing difficulties in maintaining its rebound from a three-month low as market participants seek additional evidence to confirm their cautious optimism, particularly in light of a potential rate hike in July. The XAU/USD bulls are further challenged by mixed US economic data and a lack of conviction among traders regarding the likelihood of a rate hike, despite recent statements from policymakers. Additionally, concerns over a potential slowdown in China's economic recovery, despite efforts by the state planner to accelerate key projects, are putting downward pressure on the gold price. The overall cautious sentiment ahead of upcoming US data and the testimony of Fed Chair Jerome Powell next week also presents challenges for those with optimistic views on XAU/USD, especially following this week's actions by central banks.
Diagram of XAU/USD (Gold): -

Economic Events: -
Date Event Impact Currency
01:30 (United States) Foreign Bond Investment Low USD
01:30 (United States) Net Long-term TIC Flows Medium USD
01:30 (United States) Overall Net Capital Flows Low USD
04:00 (New Zealand) Business NZ PMI Medium NZD
08:30 (Japan) BoJ Interest Rate Decision High JPY
12:30 (Austria) Inflation Rate MoM Low EUR
12:30 (Austria) Inflation Rate YoY Low EUR
12:30 (Austria) Harmonised Inflation Rate YoY Low EUR
12:30 (Austria) Harmonised Inflation Rate MoM Low EUR
12:30 (Austria) CPI High EUR
12:30 (Slovakia) Harmonised Inflation Rate YoY Low EUR
12:30 (Slovakia) Harmonised Inflation Rate MoM Low EUR
12:30 (United States) Fed Bullard Speech Medium USD
13:30 (European Union) ECOFIN Meeting Medium EUR
13:30 (Italy) Inflation Rate YoY Medium EUR
13:30 (Italy) Harmonised Inflation Rate MoM Low EUR
13:30 (Italy) Harmonised Inflation Rate YoY Low EUR
13:30 (Italy) Inflation Rate MoM Low EUR
13:30 (Italy) CPI High EUR
14:30 (Euro Area) Inflation Rate MoM Low EUR
14:30 (Euro Area) Core Inflation Rate YoY Low EUR
14:30 (Euro Area) Inflation Rate YoY Medium EUR
14:30 (Euro Area) Labour Cost Index YoY Low EUR
14:30 (Euro Area) Wage Growth YoY Low EUR
14:30 (Euro Area) CPI High EUR
14:30 (Malta) Inflation Rate YoY Low EUR
15:30 (Portugal) PPI YoY Low EUR
15:30 (Portugal) PPI MoM Low EUR
17:15 (United States) Fed Waller Speech Medium USD
18:00 (Canada) Foreign Securities Purchases Low CAD
18:00 (Canada) Foreign Securities Purchases by Canadians Low CAD
18:00 (Canada) Wholesale Sales MoM Low CAD
19:30 (United States) Michigan Consumer Sentiment High USD
19:30 (United States) Michigan Inflation Expectations Low USD
19:30 (United States) Michigan Current Conditions Low USD
19:30 (United States) Michigan 5 Year Inflation Expectations Low USD
19:30 (United States) Michigan Consumer Expectations Low USD
22:30 (United States) Baker Hughes Oil Rig Count Low USD
22:30 (United States) Baker Hughes Total Rig Count Low USD
Buy Scenario: -
On the upside, there are resistance levels that could limit the immediate upward movement of the gold price. These levels include the Fibonacci 38.2% retracement on the weekly chart, the previous daily high, and the upper band of the Bollinger Bands on the 15-minute chart, all located near $1,961-62.
Beyond that, the Fibonacci 38.2% retracement on the one-month chart, around $1,968, will act as another obstacle for the XAU/USD bulls before potentially giving them control. Till we did not advise to buy XAU/USD.
Selling Scenario: -
According to our Technical Confluence Indicator, the price of gold (XAU/USD) is currently retreating towards a key support level at $1,950, which is a significant area of confluence. This support level is formed by the Fibonacci 61.8% retracement on the weekly chart, Fibonacci 23.6% retracement on the daily chart, and the 5-day moving average (DMA).
If XAU/USD breaks below this immediate support level, similar to what occurred on Thursday, the bears will face another crucial downside level at around $1,940. This level serves as the last line of defense for the buyers and includes the 100-day moving average (DMA) and the Pivot Point one-week S1. We do not advise selling XAU/USD.
Support and Resistance Level: -
Support Resistance
S1 1935.21 - R1 1970.67
S2 1912.30 - R2 1983.22
S3 1899.75 - R3 2006.13


Discussion