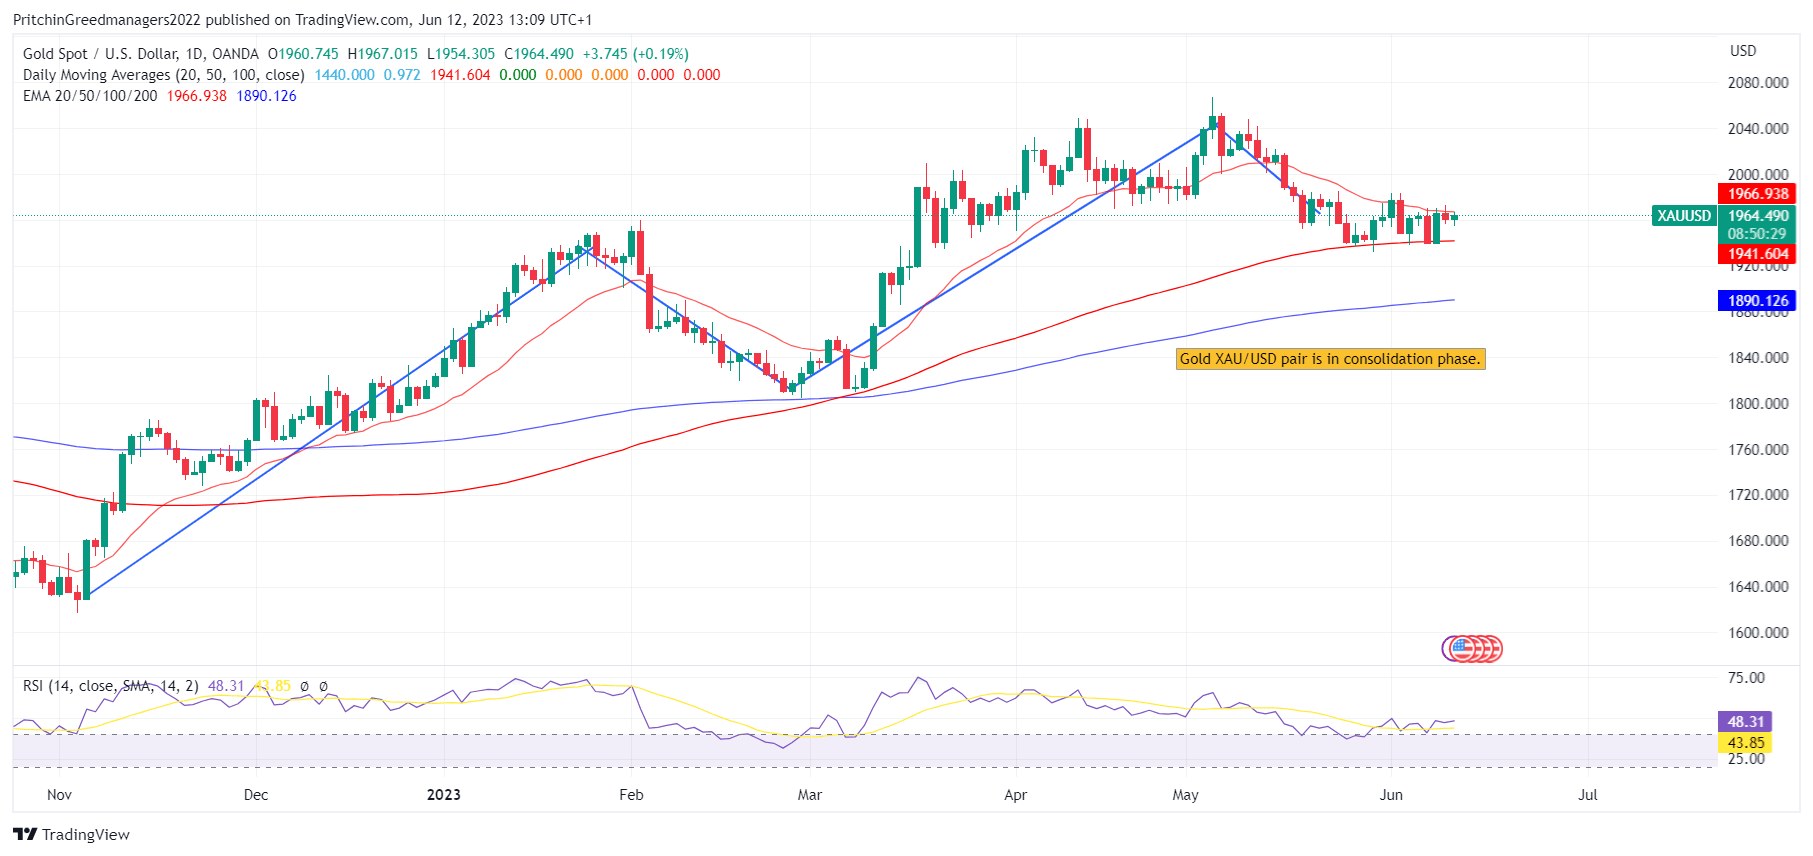
Daily Analysis For GOLD (XAU/USD) 12-06-2023
Gold (XAU/USD) Analysis
Key Points: -
· The price of gold continues to face downward pressure, struggling to break above key short-term resistance levels, as important data releases and events approach. The combination of doubts regarding a dovish verdict from the Federal Reserve (Fed) and consolidation of the US Dollar are exerting downward pressure on XAU/USD.
· The light economic calendar may provide an opportunity for gold buyers to take a break after their dominant position over the past two weeks. However, the direction of gold is likely to be influenced by the upcoming US inflation data, which holds crucial importance in providing clear signals for market participants.
· Traders and investors are closely watching the Fed's stance on monetary policy, as any indication of a less dovish approach could weigh on gold prices. Furthermore, the consolidation of the US Dollar is also contributing to the downward pressure on XAU/USD.
Today's Scenario: -
The price of gold, represented by XAU/USD, has reversed its intraday losses after a two-week upward trend. As a significant week approaches, which includes central bank announcements and US inflation data, the market's cautious optimism has failed to sustain pressure on the US Dollar due to a reassessment of the previous dovish bias regarding the Federal Reserve (Fed).
Gold buyers are finding support from the hopes that China and Japan will maintain their current interest rates, and there will be a pause in the US Treasury bond yields. These factors contribute to the expectation that the US inflation data will confirm a consensus of no rate hike from the Fed. According to CME's FedWatch Tool, there is a nearly 70% chance that the US central bank will keep the benchmark rate unchanged.
Looking ahead, the release of the US Core Consumer Price Index (CPI) on Tuesday will be crucial in determining the short-term movements of gold prices. Market participants anticipate a pause in the Fed's hawkish stance, despite looming inflation concerns. The outcome of the CPI data will provide further insight into the Fed's monetary policy direction and is likely to impact the price of gold.
Diagram of XAU/USD (Gold): -

Economic Events: -
Date Event Impact Currency
4:15 (New Zealand) Electronic Retail Card Spending YoY Low NZD
4:15 (New Zealand) Electronic Retail Card Spending MoM Low NZD
5:20 (Japan) PPI YoY Low JPY
5:20 (Japan) PPI MoM Low JPY
5:31 (Ireland) Construction PMI Low EUR
10:30 (Finland) Current Account Low EUR
11:30 (Japan) Machine Tool Orders YoY Low JPY
12:30 (Slovakia) Construction Output YoY Low EUR
13:30 (China) Total Social Financing Low CNY
13:30 (China) New Yuan Loans Low CNY
13:30 (China) M2 Money Supply YoY Low CNY
13:30 (China) Outstanding Loan Growth YoY Low CNY
13:30 (Switzerland) Myfxbook USDCHF Sentiment Medium CHF
13:30 (Australia) Myfxbook AUDUSD Sentiment Medium AUD
13:30 (Japan) Myfxbook USDJPY Sentiment Medium JPY
13:30 (European Union) Myfxbook EURUSD Sentiment Medium EUR
13:30 (United Kingdom) Myfxbook GBPUSD Sentiment Medium GBP
13:30 (Canada) Myfxbook USDCAD Sentiment Medium CAD
13:30 (New Zealand) Myfxbook NZDUSD Sentiment Medium NZD
15:15 (European Union) EU Bond Auction Low EUR
15:15 (European Union) 15-Year Bond Auction Low EUR
18:30 (Ecuador) Balance of Trade Low USD
18:30 (France) 3-Month BTF Auction Low EUR
18:30 (France) 12-Month BTF Auction Low EUR
18:30 (France) 6-Month BTF Auction Low EUR
20:30 (Kosovo) Inflation Rate YoY Low EUR
20:30 (United States) Consumer Inflation Expectations Low USD
21:00 (United States) 6-Month Bill Auction Low USD
21:00 (United States) 3-Year Note Auction Low USD
22:30 (United States) 3-Month Bill Auction Low USD
22:30 (United States) 10-Year Note Auction Low USD
23:30 (United States) Monthly Budget Statement Medium USD
Buy Scenario: -
According to our Technical Confluence Indicator, the Gold Price has experienced downward pressure as it surpassed the key resistance level of $1,960, which includes the Fibonacci 23.6% on the one-day chart and the middle band of the Bollinger on the hourly chart.
Additionally, the convergence of the 10-day moving average (DMA) and 5-DMA around $1,958 acts as an immediate hurdle for further upside movement.
It is important to note that the Fibonacci 61.8% on the one-day chart and the Fibonacci 23.6% on the one-month chart, located near $1,970, represent a significant short-term resistance level that Gold buyers need to overcome. Till we did not advise to buy XAU/USD.
Selling Scenario: -
On the downside, the 10-DMA coincides with the Pivot Point one-week S1, providing support in the short term around $1,941. However, a break below this level could expose the Gold Price to test the yearly low recorded in March around $1,932.
If the Gold Price remains bearish below $1,932, there is a possibility of further decline towards the psychological round figure level of $1,900. We do not advise selling XAU/USD.
Support and Resistance Level: -
Support Resistance
S1 1954.21 - R1 1970.71
S2 1947.18 - R2 1980.18
S3 1937.71 - R3 1987.21


Discussion