| 06:00 | - | (Estonia) PPI MoM | EUR |
| 06:00 | - | (Estonia) PPI YoY | EUR |
| 07:00 | - | (Germany) PPI YoY | EUR |
| 07:00 | - | (Germany) PPI MoM | EUR |
| 08:00 | - | (Switzerland) Myfxbook USDCHF Sentiment | CHF |
| 08:00 | - | (Australia) Myfxbook AUDUSD Sentiment | AUD |
| 08:00 | - | (Japan) Myfxbook USDJPY Sentiment | JPY |
| 08:00 | - | (European Union) Myfxbook EURUSD Sentiment | EUR |
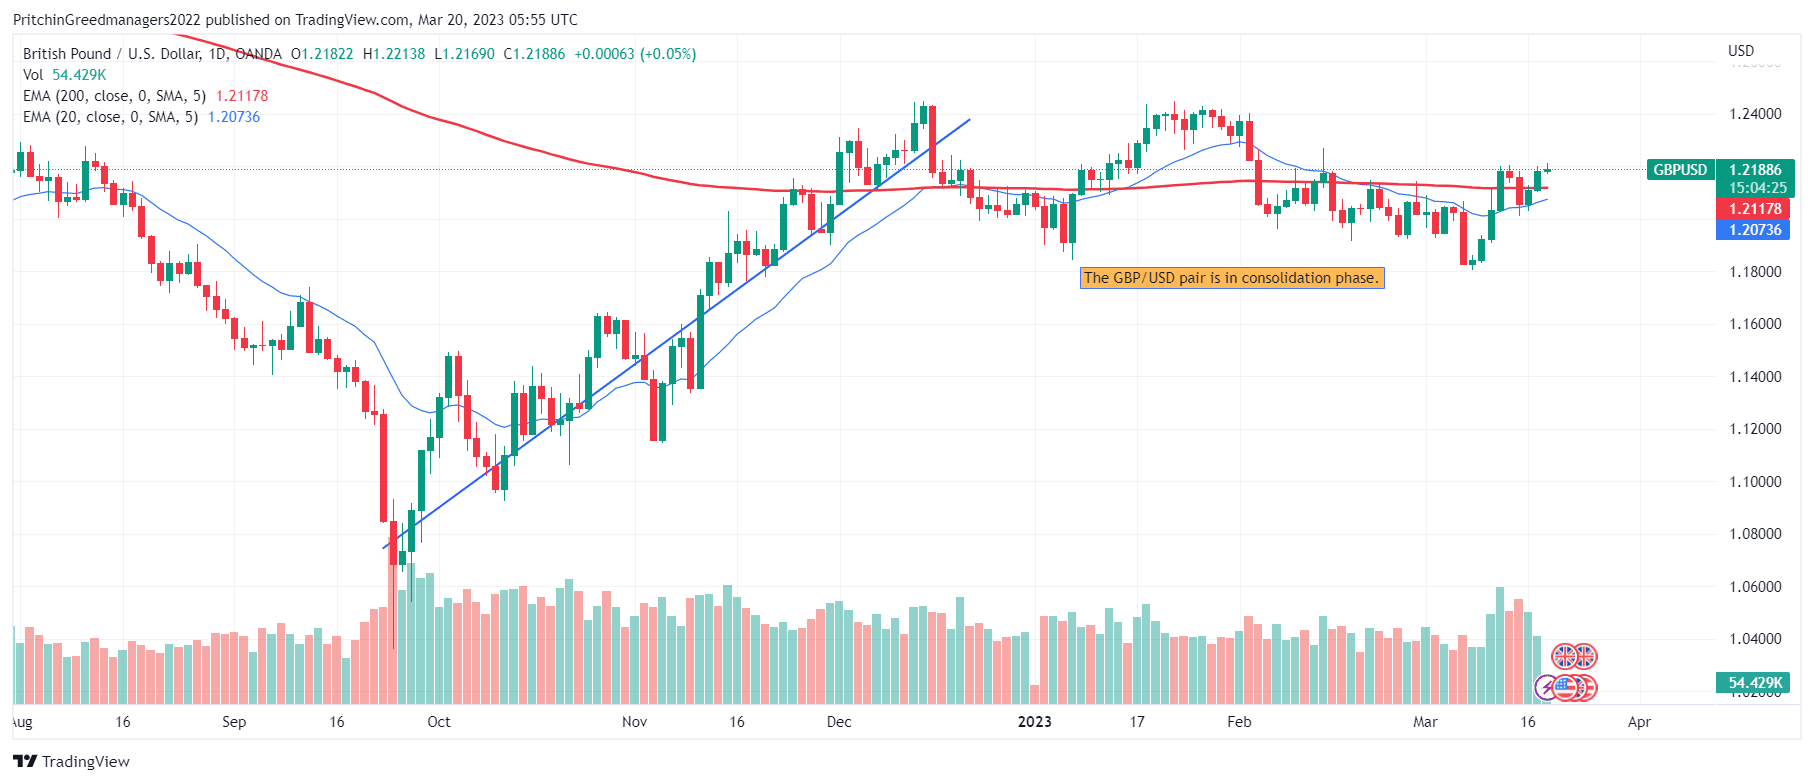
| 08:00 | - | (United Kingdom) Myfxbook GBPUSD Sentiment | GBP |
| 08:00 | - | (Canada) Myfxbook USDCAD Sentiment | CAD |
| 08:00 | - | (New Zealand) Myfxbook NZDUSD Sentiment | NZD |
| 10:00 | - | (Euro Area) Balance of Trade | EUR |
| 10:00 | - | (Slovakia) Unemployment Rate | EUR |
| 10:30 | - | (Germany) 12-Month Bubill Auction | EUR |
| 10:45 | - | (European Union) EU Bond Auction | EUR |
| 10:45 | - | (European Union) 10-Year Bond Auction | EUR |
| 11:00 | - | (Luxembourg) Unemployment Rate | EUR |
| 12:30 | - | (Canada) New Motor Vehicle Sales | CAD |
| 14:00 | - | (France) 3-Month BTF Auction | EUR |
| 14:00 | - | (France) 12-Month BTF Auction | EUR |
| 14:00 | - | (France) 6-Month BTF Auction | EUR |
| 14:00 | - | (Euro Area) ECB President Lagarde Speech | EUR |
| 15:30 | - | (United States) 3-Month Bill Auction | USD |
| 15:30 | - | (United States) 6-Month Bill Auction | USD |
| 16:00 | - | (Canada) 5-Year Bond Auction | CAD |
| 16:00 | - | (Euro Area) ECB President Lagarde Speech | EUR |
| 17:00 | - | (El Salvador) Balance of Trade | USD |
| 21:45 | - | (New Zealand) Exports | NZD |
| 21:45 | - | (New Zealand) Imports | NZD |
| 21:45 | - | (New Zealand) Balance of Trade | NZD |


Discussion