

Daily Analysis For GBP/USD 15-03-2023
| GMT | Event | Currency | |
|---|---|---|---|
| 11:30 | - | (United States) MBA 30-Year Mortgage Rate | USD |
| 12:30 | - | (United States) NY Empire State Manufacturing Index | USD |
| 12:30 | - | (United States) PPI MoM | USD |
| 12:30 | - | (United States) Core PPI MoM | USD |
| 12:30 | - | (United States) Retail Sales Ex Gas/Autos MoM | USD |
| 12:30 | - | (United States) Retail Sales MoM | USD |
| 12:30 | - | (United States) Retail Sales YoY | USD |
| 12:30 | - | (United States) Retail Sales Ex Autos MoM | USD |
| 12:30 | - | (United Kingdom) Spring Budget 2023 | GBP |
| 14:00 | - | (United States) NAHB Housing Market Index | USD |
| 14:00 | - | (United States) Business Inventories MoM | USD |
| 14:30 | - | (United States) EIA Crude Oil Stocks Change | USD |
| 14:30 | - | (United States) EIA Gasoline Stocks Change | USD |
| 20:30 | - | (United States) Net Long-term TIC Flows | USD |
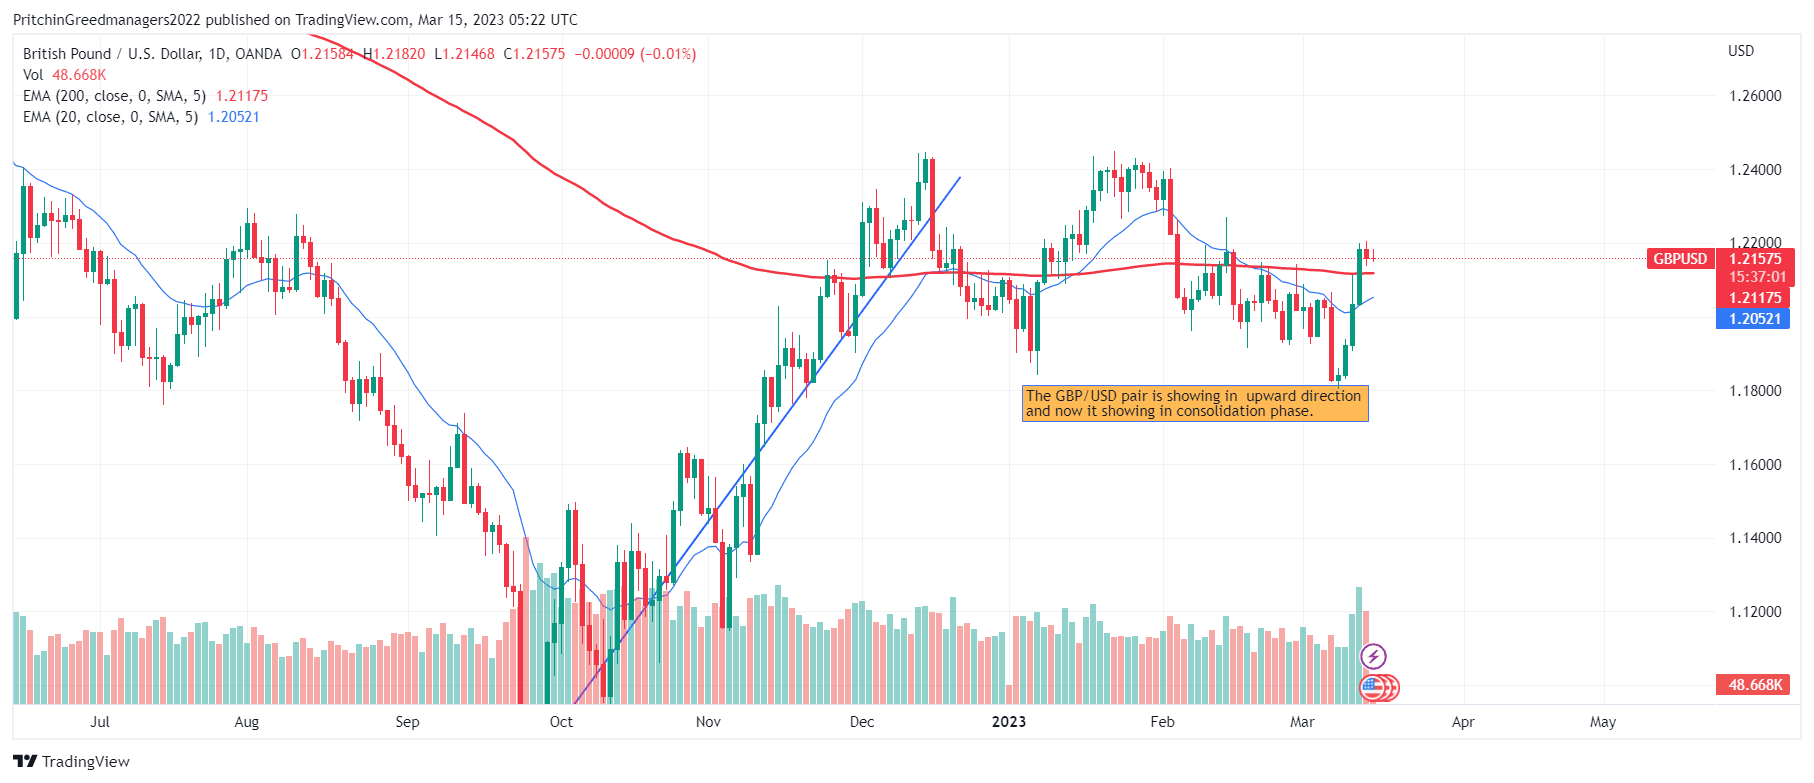
| Support | Resistance | ||
|---|---|---|---|
| S1 1.2007 | - | R1 1.2108 | |
| S2 1.1970 | - | R2 1.2172 | |
| S3 1.1906 | - | R3 1.2209 |


Discussion