

Daily Analysis For EUR/USD: Bearish Pressure & Doji Candle as on 17-07-2023
EUR/USD Analysis
Key Points: -
- The EUR/USD currency pair is experiencing a decline, reaching a new low for the day, as it retraces from its 17-month high.
- The presence of a bearish Doji candlestick and the overbought conditions indicated by the RSI (14) signal a potential further decline in the Euro's price.
- In the short term, the downside movement of the Euro is limited by a resistance line that dates back to February 2023.
- For the market to regain confidence in reaching new highs over several months, the bulls must successfully surpass the 1.1280 level.
Today's Scenario: -
The EUR/USD pair has experienced significant volatility above the key resistance level of 1.1200 during the Asian session. Market participants are in a holding pattern, awaiting the release of United States Retail Sales data for June, which will provide further guidance.
During the Tokyo session, S&P500 futures recorded losses, reflecting caution among investors as the second-quarter earnings season gets underway. Concerns over potential volatility in corporate earnings persist due to the Federal Reserve's aggressive policy tightening measures and the stringent credit conditions imposed by commercial banks to maintain asset quality.
The US Dollar Index (DXY) has exhibited reduced volatility after finding support just below the 100.00 level. The US Retail Sales data release is anticipated to trigger increased activity in the USD Index. According to consensus estimates, monthly retail demand is projected to grow at a faster pace of 0.5% compared to the previous release of 0.3%. Excluding automobile sales, retail demand is expected to expand by 0.3% compared to the previous release of 0.1%.
In contrast, the Euro has gained significant strength due to expectations that the (ECB) will continue its rate-hiking cycle beyond July. Inflationary pressures in the Eurozone have intensified, with headline inflation at 5.5% and core inflation (excluding volatile oil and food prices) at 5.4%, well above the desired rate of 2%.
However, economists at Nordea believe that the European Central Bank will view further tightening as necessary, and while another rate hike in July seems probable, it is likely to be the final one in the current cycle.
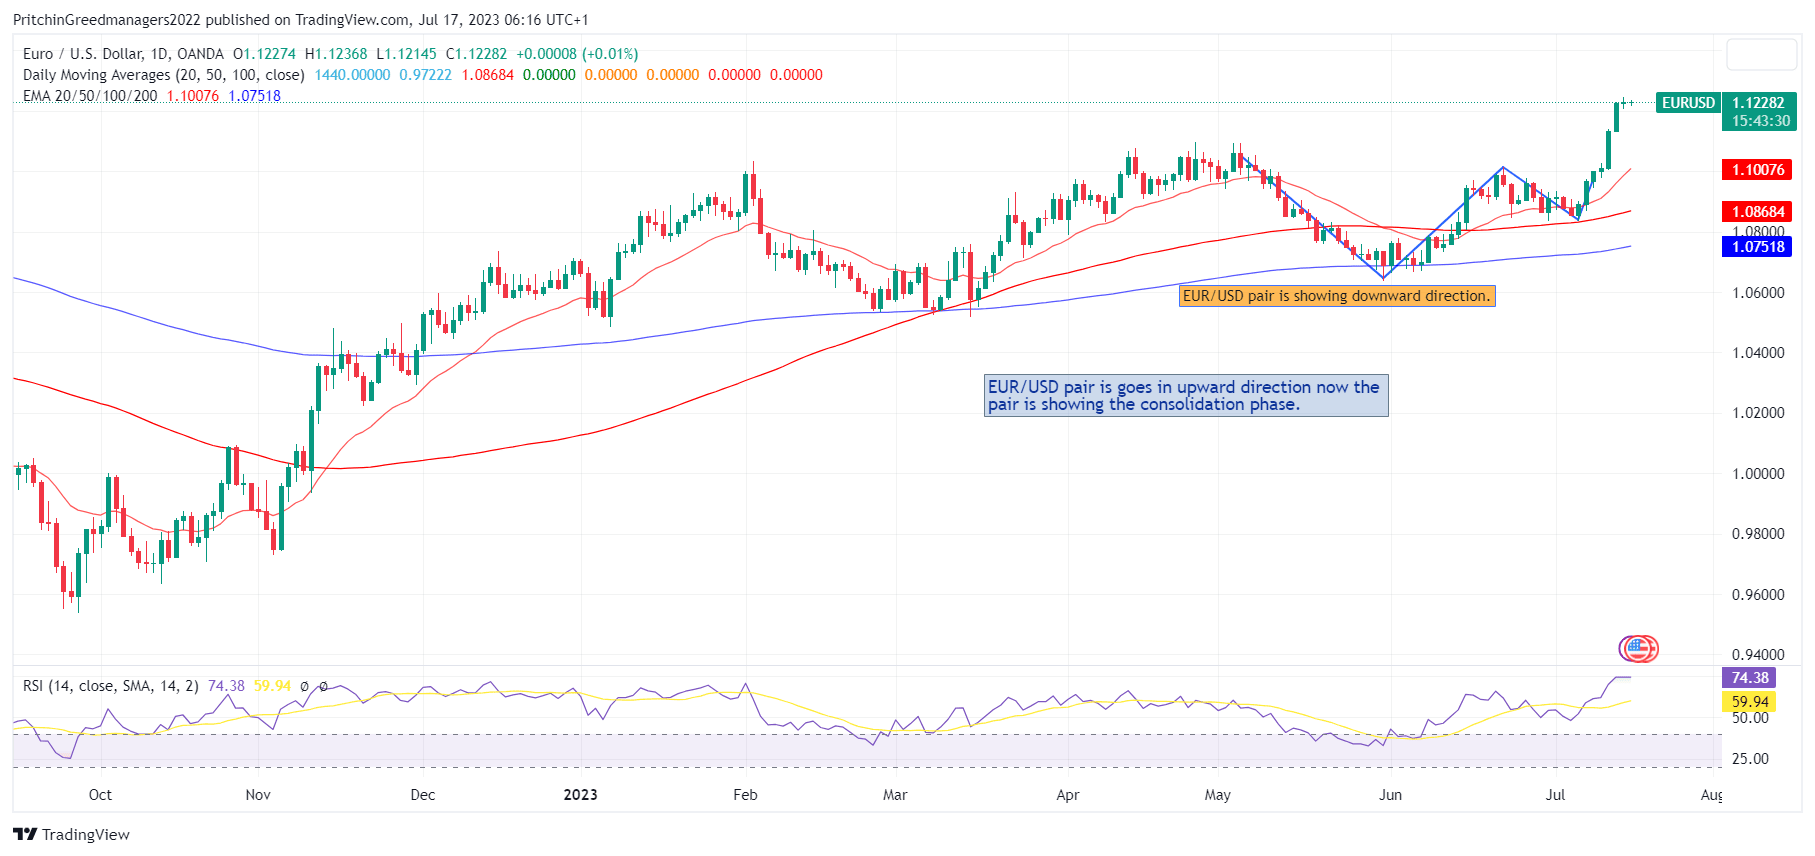
Diagram of EUR/USD: -
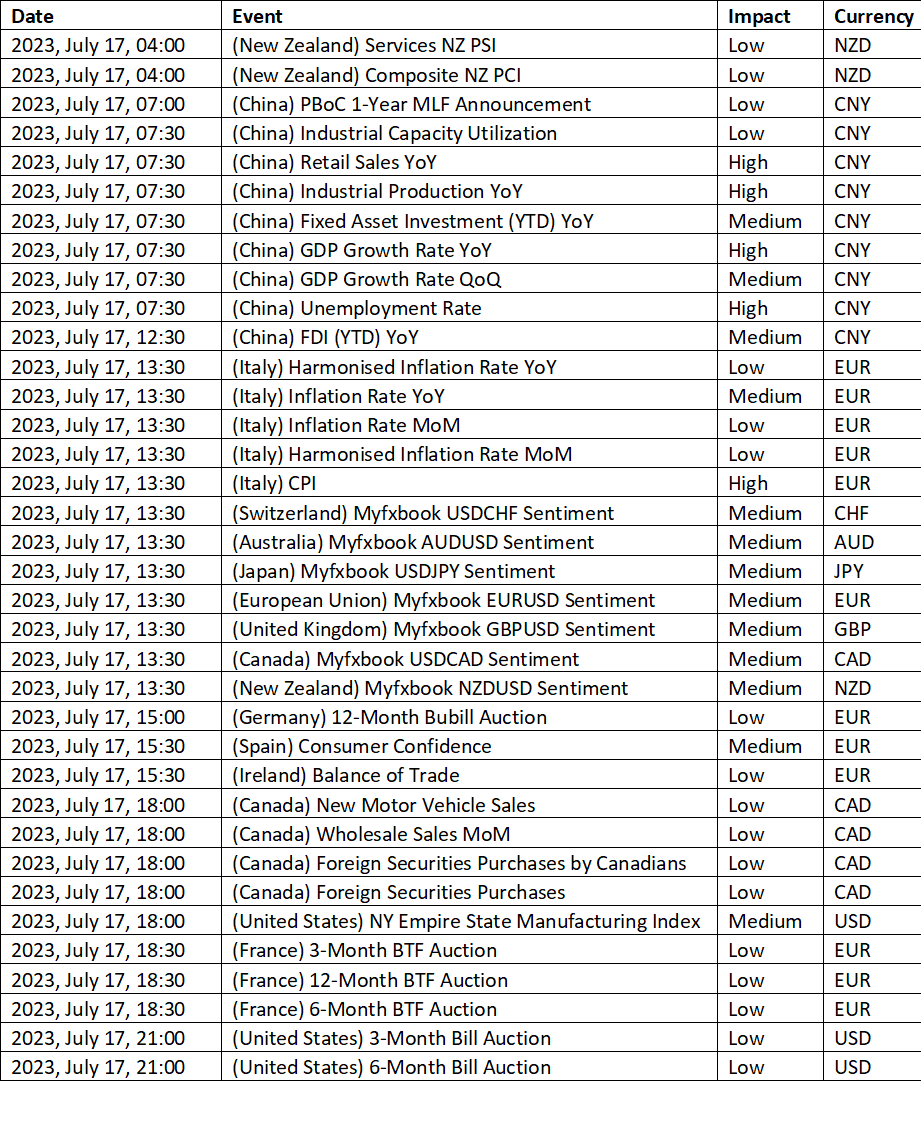
Economic Events: -
Buy Scenario: -
EUR/USD Facing Bearish Pressure Amid Overbought RSI and Doji Candlestick, if the EUR/USD manages to close above the previous day's peak of 1.1245, it would invalidate the bearish bias suggested by the recent candlestick formation. However, the presence of multiple resistance levels seen in early 2022 around 1.1280, combined with the overbought RSI, will pose a challenge for the EUR/USD bulls.
In the event that the EUR/USD pair maintains strength beyond 1.1280, the possibility of a rally towards the February 2022 peak around 1.1500 cannot be disregarded.
, till we do not advise to buy EUR/USD currency pair.
Sell Scenario: -
In the mid-Asian session on Monday, the EUR/USD pair experienced a pullback from its recent highs since February 2022, reaching its intraday low near 1.1220. This decline can be attributed to the bearish Doji candlestick formation and the overbought Relative Strength Index (RSI) (14), indicating a shift in market sentiment and teasing potential sellers.
The significance of the Doji candlestick lies in its ability to trigger price reversals, particularly when observed at multi-month highs. Furthermore, the conditions of the RSI (14) and the reassessment of the Federal Reserve's bias add weight to the likelihood of a pullback in the EUR/USD.
As EUR/USD sellers become more active, they are likely to target the previous resistance line from five months ago, now acting as a support level around 1.1160. However, before the Euro bears can take control, they will encounter additional filters such as the round figure of 1.1200 and a rising trend line that has been in place for one week, located near 1.1120.
It is important to note that the bulls' last line of defense is the April high of 1.1095. If this level is breached, it could lead to a decline towards the peak reached in June around 1.1010, with the 100-day moving average (DMA) support at 1.0860 serving as a further significant support level.
Till then we do not advise selling EUR/USD.
Support and Resistance Level: -
Support Resistance
S1 1.1206 - R1 1.1247
S2 1.1185 - R2 1.1266
S3 1.1165 - R3 1.1287


Discussion