

Daily Analysis For EUR/USD 18-01-2023
| GMT | Event | Currency | |
|---|---|---|---|
| 07:00 | - | (European Union) New Car Registrations YoY | EUR |
| 09:00 | - | (Italy) Balance of Trade | EUR |
| 10:00 | - | (Euro Area) Construction Output YoY | EUR |
| 10:00 | - | (Euro Area) Inflation Rate YoY | EUR |
| 10:00 | - | (Euro Area) CPI | EUR |
| 13:30 | - | (United States) PPI MoM | USD |
| 13:30 | - | (United States) Retail Sales Ex Gas/Autos MoM | USD |
| 13:30 | - | (United States) Retail Sales YoY | USD |
| 13:30 | - | (United States) Retail Sales Ex Autos MoM | USD |
| 13:30 | - | (United States) Retail Sales MoM | USD |
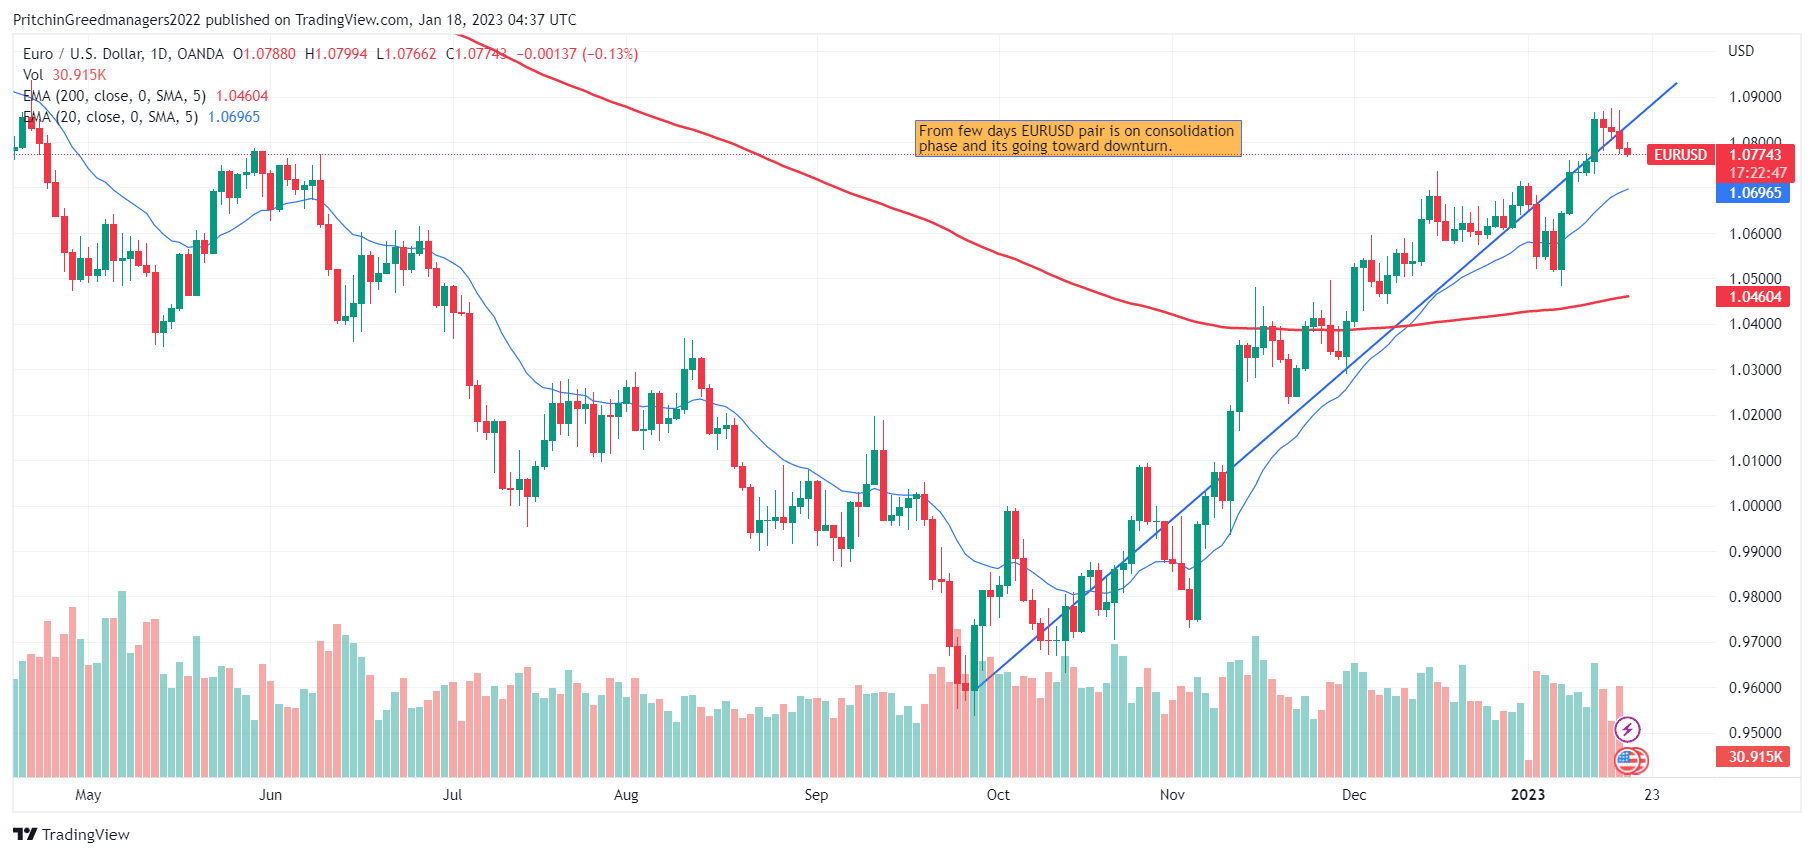
| Support | Resistance | ||
|---|---|---|---|
| S1 1.0745 | - | R1 1.0825 | |
| S2 1.0690 | - | R2 1.0870 | |
| S3 1.0640 | - | R3 1.0910 |


Discussion