

AUD/USD Price Analysis: Rebound Continues to 0.6850 Amid Australia Employment Boost- 20-07-2023
AUD/USD Analysis
Key Points: -
- The AUD/USD pair records its first daily gains in five sessions, supported by positive employment data from Australia and the People's Bank of China's (PBoC) decision to maintain certain lending rates while easing cross-border funding restrictions.
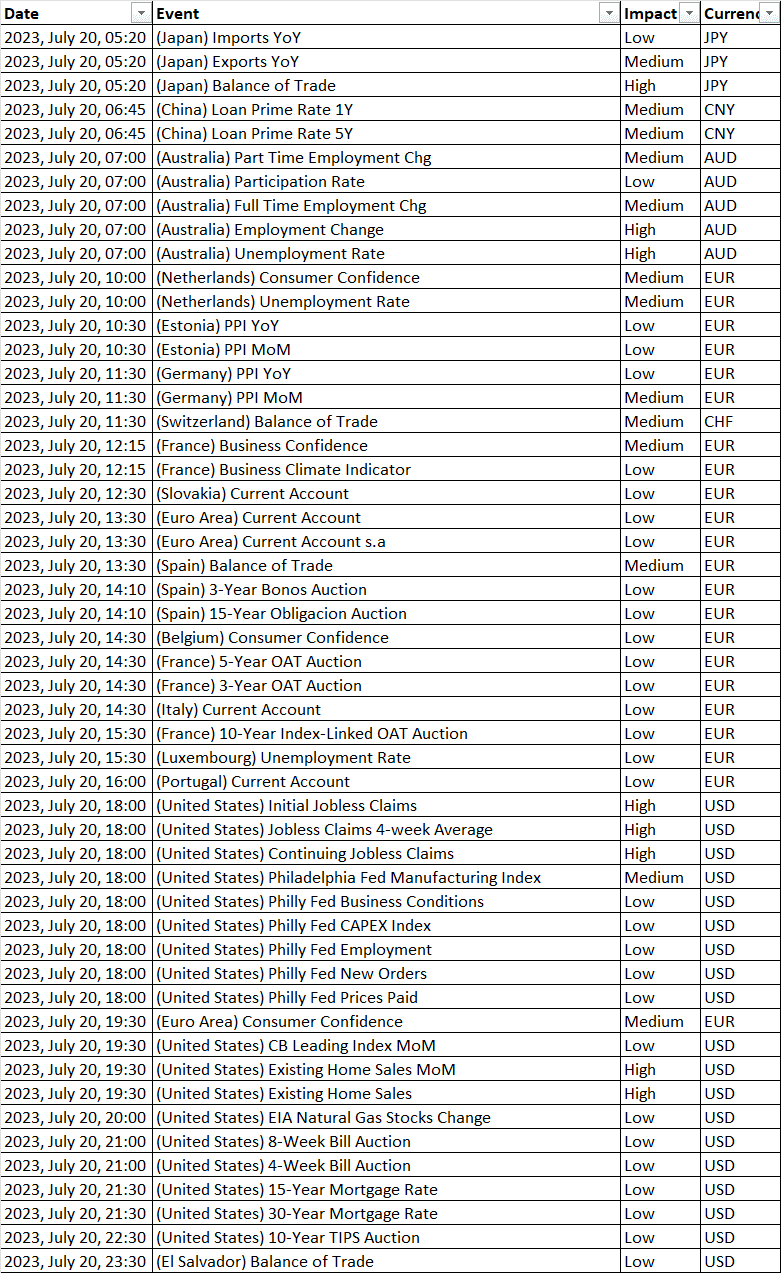
- Australia's Employment Change increased by 32.6K, and the Unemployment Rate declined to 3.6% in June, signaling a strong labor market.
- The PBoC chose to keep the one-year and five-year Loan Prime Rates (LPRs) unchanged, but it eased restrictions on cross-border funding, which may have contributed to the AUD/USD pair's gains.
- The US Dollar is consolidating its weekly gains around a multi-month low as mixed concerns about the Federal Reserve's monetary policy and China's economic situation impact the market.
Today's Scenario: -
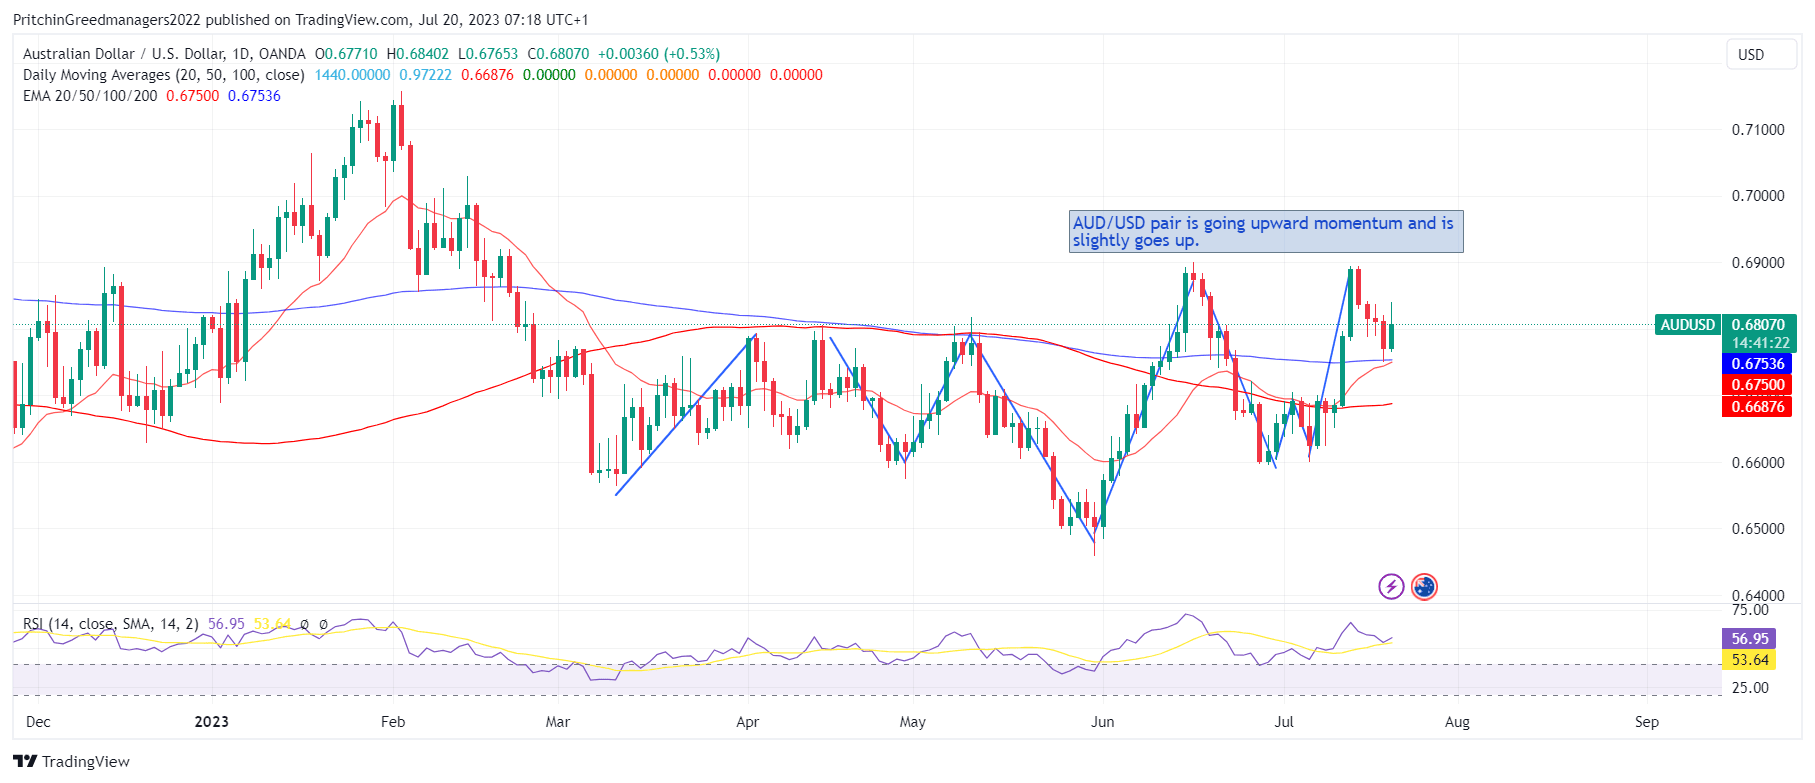
The AUD/USD pair is showing upward movement, reaching a new intraday high around 0.6825 after a quick 25 pip jump, driven by the positive Australian jobs report for June. The US Dollar's failure to sustain its two-day recovery from a 15-month low, coupled with mixed signals about the US Federal Reserve (Fed) and China, is further supporting the Aussie pair's upward momentum. This marks the first daily gains in five days for the pair.
Australia's headline Employment Change surpassed expectations, rising by 32.6K compared to the forecast of 15K, with the Unemployment Rate also showing improvement at 3.5% versus the expected 3.6%.
The People's Bank of China (PBoC) kept its benchmark Loan Prime Rates unchanged during its Interest Rate Decision. However, the central bank eased restrictions on cross-border funding by increasing the adjustment parameter for firms.
Despite front-line tech shares showing optimism due to higher rates leading to increased profits for top-tier and regional US banks, there are concerns about the prolonged period of higher rates and lack of major data/events to support bullish sentiment.
The S&P500 Futures are showing slight losses, and US Treasury bond yields are mixed at the weekly low. The US Dollar Index (DXY) is down 0.25%, retesting the 100.00 round figure, after a two-day rebound from its lowest level since April 2022. The concerns about the Fed's stance remain mixed, influenced by downbeat US housing and consumer spending data.
In the short term, headlines about China and the Fed will be critical in determining AUD/USD movements. Additionally, the US Initial Jobless Claims and Existing Home Sales will be of interest on the economic calendar.
Diagram of AUD/USD: -
Economic Events: -
Buy Scenario: -
AUD/USD pair bounced off the 200-Exponential Moving Average (EMA) with bullish MACD signals and a positive RSI (14) line, indicating potential further upside towards the resistance confluence at 0.6900. This level encompasses the tops marked in June-July and also includes the 61.8% Fibonacci retracement level of the pair's downside movement from February to May.
It is worth noting that the RSI (14) is currently above 50.0 and may soon enter the overbought territory, which could potentially challenge the AUD/USD bulls as they attempt to surpass the 0.6900 round figure.
However, the likelihood of the AUD/USD pair surpassing 0.6900 and moving higher seems less probable. If such an event occurs, the next target would be the psychological level of 0.7000, and if the bullish momentum continues, it might aim for the mid-February swing high of approximately 0.7030. Till we do not advise to buy AUD/USD.
Sell Scenario: -
On the downside, a daily close below the 200-EMA level around 0.6750 does not necessarily imply an open invitation for the AUD/USD bears, as an ascending support line from May 31, located near 0.6695, will serve as an additional obstacle for further bearish movement. Till we do not advise to sell AUD/USD.
Support and Resistance Level: -
Support Resistance
S1 0.6741 - R1 0.6811
S2 0.6711 - R2 0.6851
S3 0.6671 - R3 0.6881


Discussion