

Understanding Money Flow Index and How Money Flow Index Works
In the fast-paced world of finance and investing, numerous tools and indicators assist traders in making informed decisions. One such tool is the Money Flow Index (MFI), a popular technical indicator used to analyze the flow of money into and out of a particular asset or security. This article aims to comprehensively understand the Money Flow Index and how it operates within the financial markets.
Table of Contents
- Introduction
- Understanding the Money Flow Index (MFI)
- Calculating the Money Flow Index
- Interpreting the Money Flow Index
- Using MFI in Technical Analysis
- MFI as a Tool for Identifying Trends
- Identifying Overbought and Oversold Conditions
- Combining MFI with Other Indicators
- Limitations of the Money Flow Index
- Footnote
- FAQs
Introduction
The Money Flow Index (MFI) is a popular technical indicator traders, and investors use to analyze money flow into and out of a specific asset or security. It provides valuable insights into the strength and direction of money movement, aiding market participants in making informed trading decisions.
At its core, the MFI is based on the principle that price and volume data can reveal important trends and patterns in the market. By combining price and volume information, the MFI helps traders identify potential overbought or oversold conditions and bullish or bearish divergences.
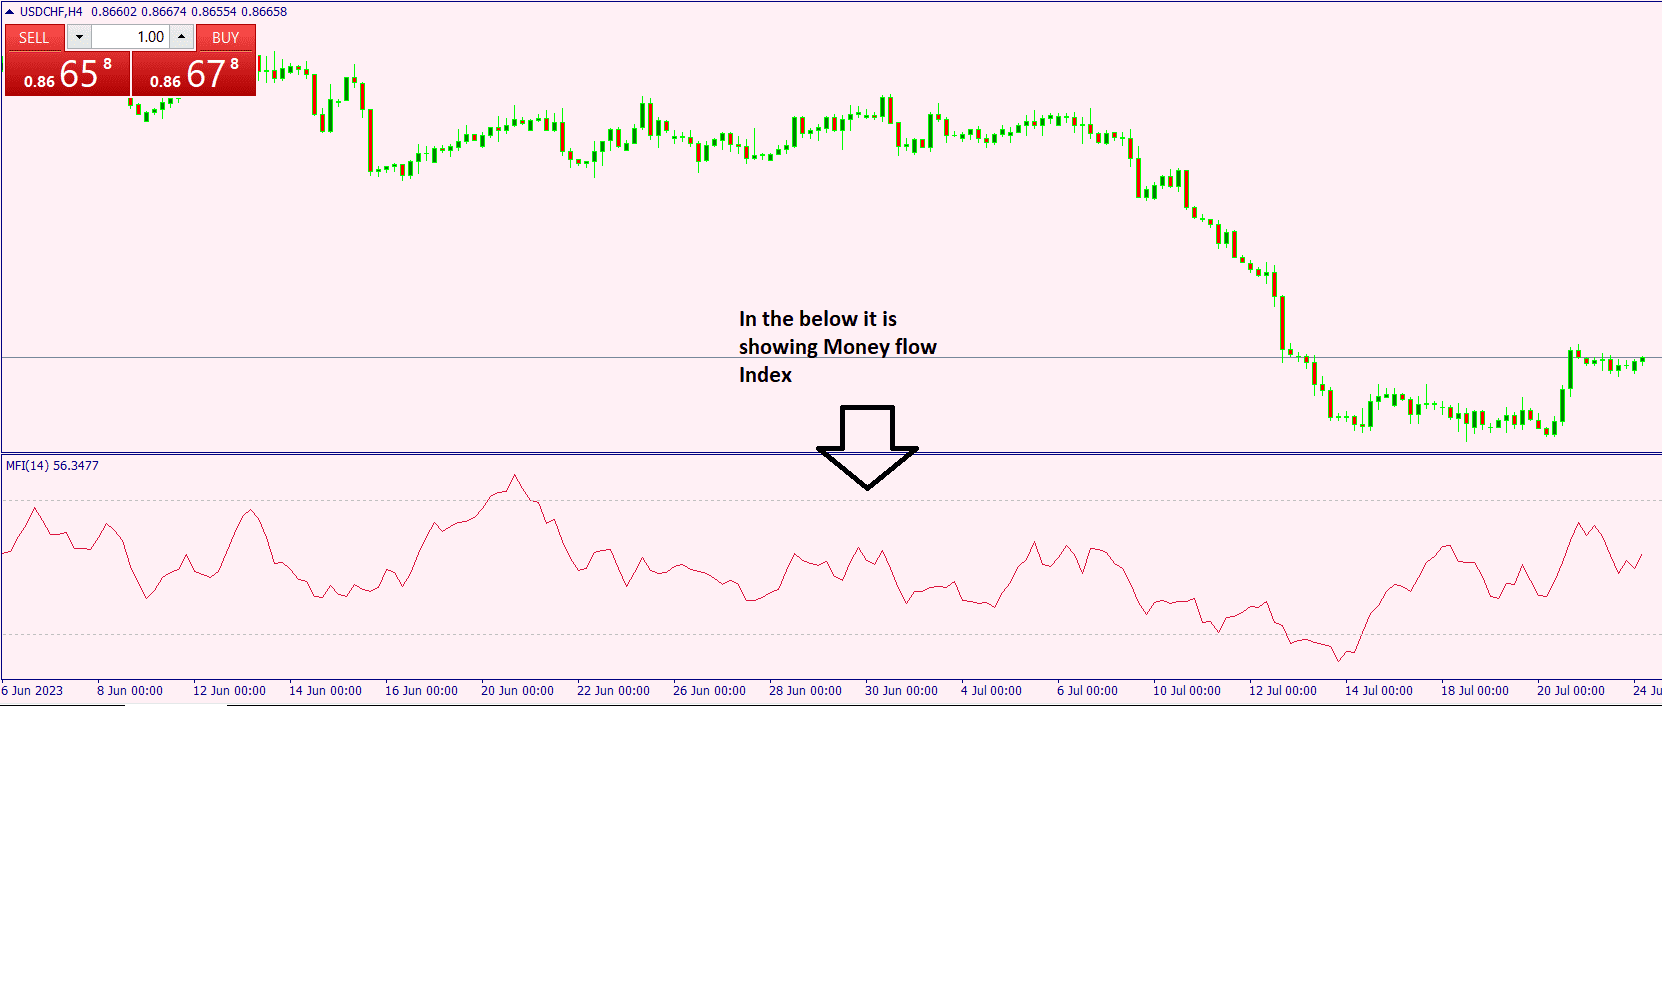
Image of MFI Indicator
Understanding the Money Flow Index (MFI)
The Money Flow Index, also known as the volume-weighted Relative Strength Index (RSI), is a technical indicator that measures the intensity of money flowing in and out of a particular financial instrument over a specific period. It combines price and volume data to assess the buying and selling pressure in the market.
Calculating the Money Flow Index
The formula for calculating the Money Flow Index (MFI) involves several steps. It combines the concepts of positive and negative money flow, as well as the typical price of the asset. The MFI is typically calculated over a specified period, commonly 14 days. Here is the step-by-step formula:
- Calculate the Typical Price (TP):
- Add the high, low, and closing prices of the asset for a specific period (e.g., a day).
- Divide the sum by 3 to get the Typical Price (TP).
Formula for Typical Price (TP) = (High Price + Low Price + Closing Price) / 3
- Determine the Money Flow (MF):
- Multiply the Typical Price (TP) by the volume of shares or contracts traded for that period.
- This will give you the Money Flow (MF) for each trading period.
Formula for Positive Money Flow (PMF) = TP * Volume (when TP is higher than the previous TP) Formula for Negative Money Flow (NMF) = TP * Volume (when TP is lower than the previous TP)
- Calculate the Money Ratio (MR):
- Calculate the ratio of Positive Money Flow (PMF) to Negative Money Flow (NMF) for the specified period.
Formula for Money Ratio (MR) = Sum of PMF / Sum of NMF
- Calculate the Money Flow Index (MFI):
- The Money Flow Index is calculated using the Money Ratio (MR).
- It is converted to a value between 0 and 100.
Formula for Money Flow Index (MFI) = 100 - (100 / (1 + MR))
The resulting MFI value can be used to assess the strength and direction of money flow into or out of the asset. A value above 80 is often considered overbought, suggesting a potential reversal or correction, while a value below 20 is considered oversold, indicating a possible price rebound. Traders use these MFI levels and other technical indicators to make informed decisions in the financial markets.
Interpreting the Money Flow Index
The MFI ranges from 0 to 100, and its interpretation involves key levels and signals:
- An MFI value above 80 suggests that the asset is overbought, indicating a potential price reversal or correction.
- An MFI value below 20 suggests that the asset is oversold, hinting at a possible price rebound.
- A bullish divergence occurs when the asset's price makes lower lows, but the MFI makes higher lows, indicating a potential trend reversal to the upside.
- Bearish divergence occurs when the asset's price makes higher highs, but the MFI makes lower highs, suggesting a possible trend reversal to the downside.
Using MFI in Technical Analysis
The Money Flow Index (MFI) is a powerful technical indicator that can provide valuable insights when conducting technical analysis in the financial markets. It combines both price and volume data to assess the strength and direction of money flow into or out of a specific asset or security. Traders and investors often use the MFI to make informed decisions and identify potential trading opportunities. Let's explore how to use the MFI effectively in technical analysis:
- Identifying Overbought and Oversold Conditions: The MFI ranges from 0 to 100. A reading above 80 is generally considered overbought, indicating that the asset's price may have risen too quickly, and a correction could be imminent. On the other hand, an MFI reading below 20 is often seen as oversold, suggesting that the asset's price may have dropped too rapidly and a rebound may be on the horizon. These overbought and oversold conditions can signal potential entry or exit points for traders.
- Confirming Price Movements: The MFI can be used to confirm the strength of a price movement. When the price of an asset is rising, and the MFI is also increasing, it suggests strong buying pressure and validates the upward trend. Conversely, if the price falls and the MFI decreases, it confirms strong selling pressure and validates the downward trend. This confirmation helps traders gain confidence in their analysis and trading decisions.
- Using MFI with Other Indicators: MFI works well in combination with other technical indicators. For example, traders often use MFI in conjunction with moving averages or trend lines to confirm trend changes. When the MFI crosses above or below a certain threshold along with a moving average, it can signal a potential trend reversal. Additionally, using MFI in combination with other oscillators, such as the Relative Strength Index (RSI), can provide complementary insights into market conditions.
- Divergence: Divergence occurs when the price of an asset and the MFI move in opposite directions. Bullish divergence happens when the price forms lower lows while the MFI forms higher lows. This can indicate a potential upward reversal in the price. Conversely, bearish divergence occurs when the price forms higher highs while the MFI forms lower highs, suggesting a potential downward reversal. Divergence can be a strong signal for traders to watch for potential trend changes.
- Timeframe Consideration: Traders should consider the timeframe they are analyzing when using the MFI. Shorter timeframes may result in more frequent but potentially less reliable signals, while longer timeframes may provide more significant and reliable signals but occur less frequently. Adjusting the timeframe can help match the trading strategy and risk tolerance of the individual trader.
MFI as a Tool for Identifying Trends
The Money Flow Index (MFI) is not only useful for identifying overbought and oversold conditions but also serves as a valuable tool for identifying trends in the financial markets. By analyzing the MFI in the context of price movements, traders can gain insights into the strength and sustainability of a trend, helping them make more informed trading decisions. Here's how the MFI can be utilized as a tool for identifying trends:
- Confirming Trend Direction: When an asset is in an uptrend, the MFI tends to stay above the 50 level, indicating that buying pressure is dominant. Conversely, during a downtrend, the MFI usually stays below 50, suggesting that selling pressure is prevailing. By observing the MFI's position relative to the 50 level, traders can confirm the direction of the underlying trend.
- Identifying Trend Reversals: The MFI can also help identify potential trend reversals. As a trend loses momentum, the MFI may diverge from the price action. For instance, during a bullish trend, the asset's price may continue to rise, but the MFI starts making lower highs, indicating weakening buying pressure. This bearish divergence could signal a potential trend reversal to the downside. Conversely, during a bearish trend, the asset's price may continue to decline, but the MFI starts making higher lows, indicating weakening selling pressure. This bullish divergence could signal a potential trend reversal to the upside.
- Recognizing Trend Strength: High readings on the MFI during an uptrend suggest strong buying pressure, indicating a robust and healthy upward movement. Similarly, low readings on the MFI during a downtrend imply strong selling pressure, reflecting a significant and sustainable downward movement. Traders can use these MFI readings to assess the strength of a trend and determine whether it is likely to continue or weaken.
- MFI Slope: The slope of the MFI line can also provide valuable trend information. A rising MFI suggests increasing buying pressure, indicating a strengthening bullish trend. On the other hand, a declining MFI indicates increasing selling pressure, signaling a deepening bearish trend. Monitoring the slope of the MFI line can offer additional insights into the dynamics of the trend.
- Using Moving Averages with MFI: Combining the MFI with moving averages can enhance trend identification. Traders often use a moving average of the MFI to smoothen the data and generate clearer signals. When the MFI crosses above its moving average, it may indicate the beginning of an uptrend, while a cross below the moving average may suggest the start of a downtrend.
Identifying Overbought and Oversold Conditions
Identifying overbought and oversold conditions is one of the primary uses of the Money Flow Index (MFI) in technical analysis. The MFI is a valuable tool for determining when an asset's price has moved too far in one direction, signaling a potential reversal or correction in the near future. Traders and investors use the MFI to avoid entering positions at extreme price levels and to anticipate potential opportunities. Here's how the MFI can help identify overbought and oversold conditions:
- Understanding MFI Range: The MFI ranges between 0 and 100. A reading above 80 typically indicates that the asset is overbought, meaning the price has risen too quickly and may be due for a pullback or correction. Conversely, a reading below 20 suggests that the asset is oversold, indicating that the price has dropped too rapidly and may be poised for a rebound.
- Spotting Overbought Conditions: When the MFI rises above the 80 level, it indicates a surge in buying pressure and potential overbought conditions. At this point, the price of the asset may have reached an unsustainable level, and traders should exercise caution before entering new long positions. Overbought conditions suggest that the asset's price is likely to reverse or consolidate in the short term, providing an opportunity for traders to consider selling or taking profits.
- Identifying Oversold Conditions: When the MFI falls below the 20 level, it signifies a surge in selling pressure and potential oversold conditions. The asset's price may have declined too rapidly, and a rebound or consolidation may be imminent. Traders could consider this an opportunity to look for potential buying opportunities or to close out existing short positions.
- Divergence as a Confirmation: While overbought and oversold conditions are essential on their own, traders often look for confirmation through divergence. Bullish divergence occurs when the price of the asset makes lower lows, but the MFI forms higher lows. This suggests that while the price declines, the selling pressure diminishes, indicating a potential trend reversal to the upside. Conversely, bearish divergence occurs when the price forms higher highs, but the MFI makes lower highs. This signals that while the price is rising, the buying pressure is waning, implying a possible trend reversal to the downside.
- Considering Timeframes: Traders should consider the timeframe they are analyzing when interpreting overbought and oversold conditions using the MFI. Shorter timeframes may result in more frequent overbought or oversold readings, but they may be less significant. Longer timeframes may provide stronger signals, but they may occur less frequently. Traders can adjust the timeframe to suit their trading strategy and preferences.
Combining MFI with Other Indicators
Combining the Money Flow Index (MFI) with other technical indicators can enhance the effectiveness of trading strategies and provide more robust signals. By using the MFI in conjunction with other indicators, traders can gain deeper insights into market trends and potential price movements. Here are some common ways to combine the MFI with other indicators:
- Moving Averages (MA): Combining the MFI with moving averages is popular. Traders often use a moving average of the MFI to smooth out the data and generate clearer signals. For example, when the MFI crosses above its moving average, it may indicate the start of a bullish trend, while a cross below the moving average may suggest the beginning of a bearish trend. The moving average can help traders filter out noise and identify the overall trend direction.
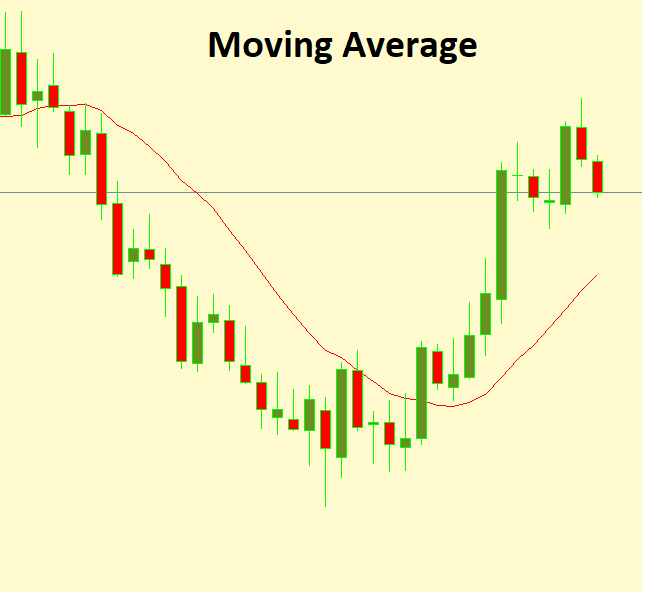
Image of Moving Average
- Relative Strength Index (RSI): The RSI and MFI are both momentum oscillators that measure overbought and oversold conditions. By using both indicators together, traders can validate signals and gain more confidence in their decisions. For example, if the MFI and RSI both indicate overbought conditions simultaneously, it strengthens the signal that the asset is likely to experience a price correction. Similarly, if both indicators signal oversold conditions, it reinforces the potential for a price rebound.
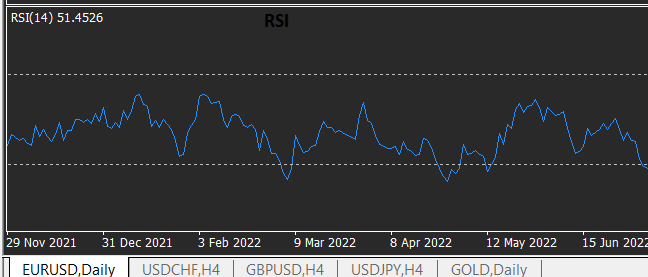
Image of RSI
- Moving Average Convergence Divergence (MACD): The MACD is a trend-following indicator that helps identify changes in a trend's strength, direction, and momentum. When combined with the MFI, traders can use the MACD to confirm the MFI's signals. For instance, if the MFI indicates overbought conditions and the MACD also shows a bearish crossover, it confirms a potential trend reversal to the downside.
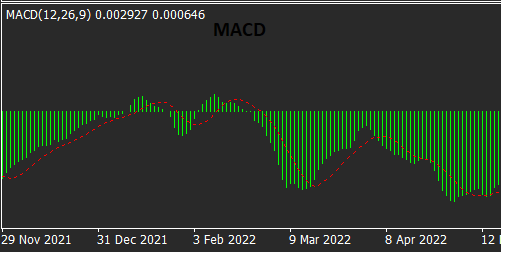
Image of MACD
- Bollinger Bands: Bollinger Bands consist of a moving average and two standard deviation bands that envelope the price action. Combining Bollinger Bands with the MFI can help identify periods of increased volatility and potential trend changes. When the MFI reaches extreme levels (overbought or oversold) and the asset's price touches or breaches the outer Bollinger Band, it may suggest a high probability of a price reversal.
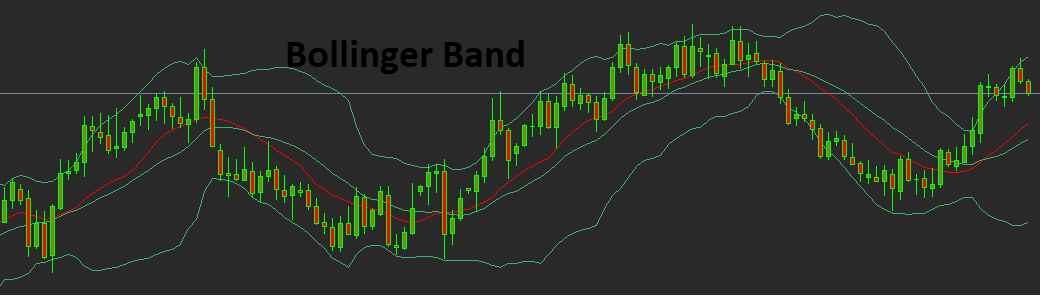
Image of Bollinger Band
- Volume Analysis: Since the MFI incorporates volume data, it can be used in conjunction with volume analysis to validate signals. For example, during an uptrend, if the MFI shows increasing values while volume is also rising, it reinforces the strength of the upward movement. On the contrary, if the MFI shows decreasing values while volume is rising during a downtrend, it might indicate weakening selling pressure and a potential trend reversal.
Limitations of the Money Flow Index
While the Money Flow Index (MFI) is a valuable technical indicator, it does have certain limitations that traders should be aware of when using it in their analysis. Understanding these limitations can help traders make more informed decisions and avoid potential pitfalls. Here are some of the key limitations of the Money Flow Index:
- Lagging Indicator: Like many other technical indicators, the MFI is a lagging indicator, meaning it relies on past price and volume data to generate signals. As a result, the MFI may not provide timely signals for fast-moving markets or sudden price reversals. Traders should be cautious and use the MFI in conjunction with other leading indicators to complement their analysis.
- Choppiness in Range-Bound Markets: The MFI tends to perform best in trending markets, where buying or selling pressure is more consistent. However, in range-bound markets with low price volatility, the MFI can produce frequent and contradictory overbought and oversold signals, making it challenging to interpret accurately.
- Limited Application to Low-Volume Assets: The MFI's effectiveness relies on volume data, which can be problematic for assets with low trading volumes. In such cases, the MFI may not provide reliable signals, leading to potential misinterpretation and false trading decisions.
- Vulnerable to Price Gaps: Price gaps, which occur when an asset's price opens significantly higher or lower than the previous day's closing price, can impact the MFI's calculations. These gaps can lead to distortions in the MFI values and potentially generate false signals.
- Not Suitable for All Securities: While the MFI is commonly used for analyzing stocks, ETFs, and indices, it may be less effective for certain types of assets, such as commodities or currencies. Different assets have unique characteristics, and the MFI's assumptions may not always align with their price and volume behaviors.
- Subject to Interpretation: The interpretation of MFI signals can vary among traders, leading to subjective judgments on entry and exit points. Traders should exercise caution and use additional technical analysis tools to confirm the MFI's signals.
- Historical Performance May Not Predict Future Outcomes: Past performance of the MFI does not guarantee future results. Market conditions and dynamics can change, and historical patterns may not hold true in the future. Traders should continuously evaluate the effectiveness of the MFI within current market conditions.
Footnote
The Money Flow Index (MFI) is a powerful technical indicator providing valuable information about the market's money flow. It helps traders identify trends, potential reversals, and overbought or oversold conditions. However, it is crucial to remember that no single indicator guarantees success in trading. Combining MFI with other tools and adopting a comprehensive approach to market analysis can greatly improve trading decisions.
FAQs
1. Is the Money Flow Index suitable for all types of assets?
- While the Money Flow Index can be applied to various financial instruments, its effectiveness may vary depending on the asset's liquidity and trading volume. It is essential to consider the specific characteristics of the asset before using MFI.
2. Can the Money Flow Index be used for long-term investing?
- The Money Flow Index is primarily a short to medium-term indicator and is more commonly used for trading rather than long-term investing. Long-term investors may find other fundamental macroeconomic indicators more relevant.
3. How often should I check the Money Flow Index during trading?
- The frequency of checking the Money Flow Index depends on your trading style and strategy. Some traders monitor it regularly throughout the trading day, while others may review it daily or weekly.
4. Can MFI be used in conjunction with fundamental analysis?
- MFI can be combined with fundamental analysis to create a more comprehensive view of the market. By integrating technical and fundamental perspectives, traders can make well-informed decisions.
5. Does the Money Flow Index work in highly volatile markets?
- The Money Flow Index can be effective in volatile markets, as it considers both price and volume data. However, during extreme market conditions, it is essential to exercise caution and use additional indicators to confirm signals.


Discussion