

Technical Analysis Tools for Forex Traders: A Comprehensive Guide
Forex trading is a complex and dynamic market where traders analyze price movements to make informed decisions. To navigate this vast and ever-changing landscape, forex traders rely on various technical analysis tools. These tools, such as technical indicators, chart patterns, and oscillators, provide valuable insights into market trends, price patterns, and potential trading opportunities. In this article, we will explore some of the most commonly used technical analysis tools in forex trading and discuss how they can help traders gain an edge in the market.
Table of Contents
- Introduction to Technical Analysis
- Trend Indicators
- Moving Averages
- Bollinger Bands
- Average Directional Index (ADX)
- Exponential Moving Average (EMA)
- Oscillators
- Relative Strength Index (RSI)
- Stochastic Oscillator
- MACD (Moving Average Convergence Divergence)
- Chart Patterns
- Head and Shoulders
- Double Tops and Bottoms
- Flags and Pennants
5. Average True Range (ATR)
- Fibonacci Retracement
7. Ichimoku Cloud
- Pivot Points
- Parabolic SAR (Stop and Reverse)
- Volume
- Average True Range (ATR)
- On-Balance Volume (OBV)
- Williams %R
- Chaikin Money Flow (CMF)
- RSI Divergence
- Conclusion
- FAQs
1. Introduction to Technical Analysis
Technical analysis is a method of analyzing historical price data to predict future price movements. Forex traders use technical analysis to identify trends, reversals, and potential entry and exit points. By understanding the principles and applications of technical analysis tools, traders can make more informed trading decisions.
2. Trend Indicators
Trend indictors are those indicators which show the price is following the trend, there are some trend indicators which we are understand the technical analysis.
· Moving Averages:
Moving averages are popular trend indicators that smooth out price data over a specified period. They provide traders with a clear visual representation of the overall trend. The two common types of moving averages are the simple moving average (SMA) and the exponential moving average (EMA).

In the diagram is showing SMA (Simple Moving Average)
· Bollinger Bands:
Bollinger Bands consist of a simple moving average and two standard deviation bands. These bands expand and contract based on price volatility. Traders use Bollinger Bands to identify overbought and oversold conditions and anticipate potential price reversals.
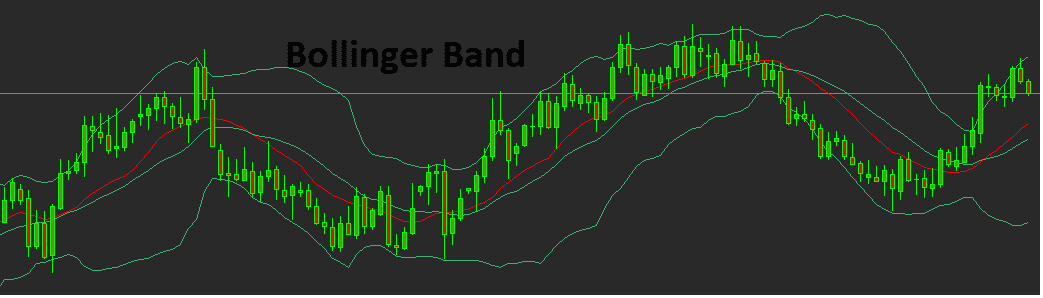
In the above it is showing the Bollinger band with standard deviation band.
· Average Directional Index (ADX):
The Average Directional Index (ADX) measures the strength of a trend. It helps traders determine whether a market is trending or ranging. A high ADX reading suggests a strong trend, while a low ADX reading indicates a weak trend or a ranging market.
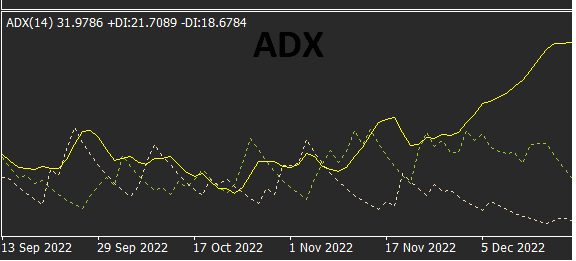 The above image is showing the ADX
· Exponential Moving Average (EMA):
Exponential Moving Average is a variation of the Moving Average that gives more weight to recent price data, making it more responsive to changes in price. It is commonly used to identify short-term trend reversals.
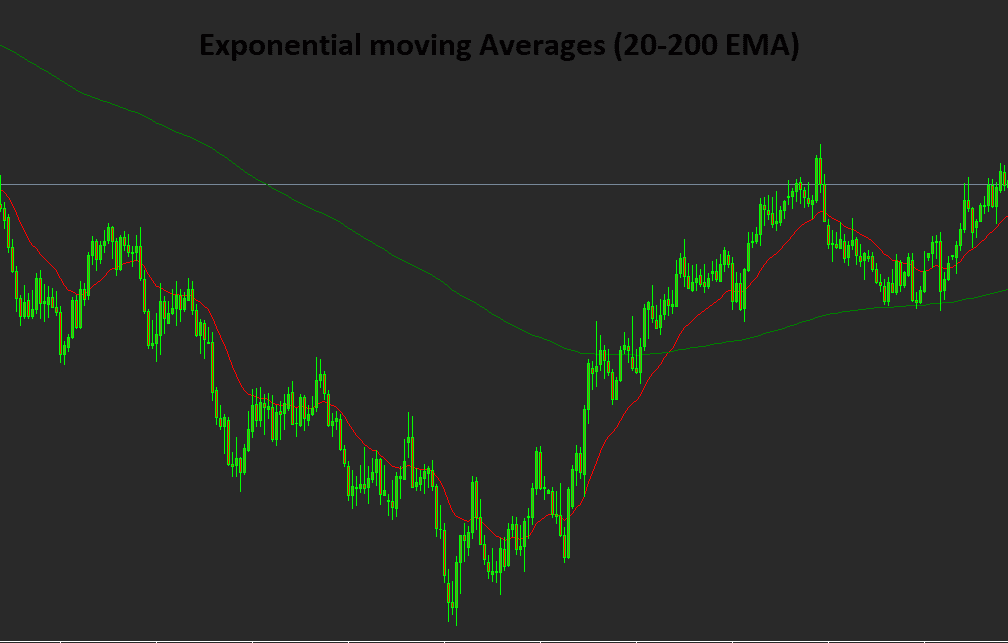 The above image is in EMA with 20 and 200 the nearer is the 20 EMA and the other one is 200 EMA.
3. Oscillators
· Relative Strength Index (RSI):
The Relative Strength Index (RSI) is a momentum oscillator that compares the magnitude of recent price gains to recent price losses. It provides traders with an indication of overbought or oversold conditions. The RSI values range from 0 to 100, with readings above 70 suggesting overbought conditions and readings below 30 indicating oversold conditions.
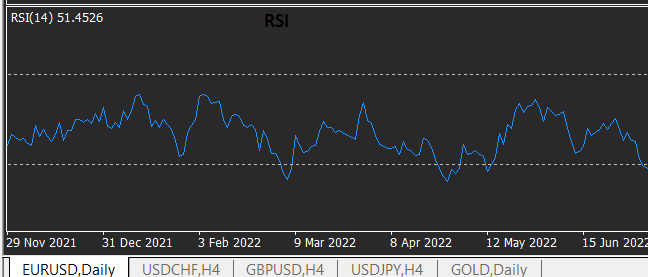
The image is showing the RSI which is 30-70 levels.
· Stochastic Oscillator:
The Stochastic Oscillator is another popular momentum oscillator. It compares the closing price of a forex pair to its price range over a specified period. The Stochastic Oscillator consists of two lines, %K and %D, which help identify potential reversals and divergences.
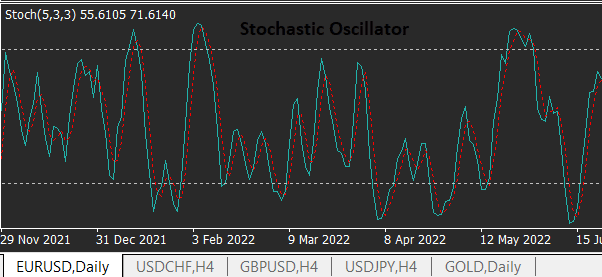
The above image is of Stochastic Oscillator which is look like.
· MACD (Moving Average Convergence Divergence):
The Moving Average Convergence Divergence (MACD) is a versatile indicator that combines moving averages with oscillators. It consists of two lines, the MACD line and the signal line, as well as a histogram. Traders use MACD to identify trend direction, momentum, and potential entry or exit points.
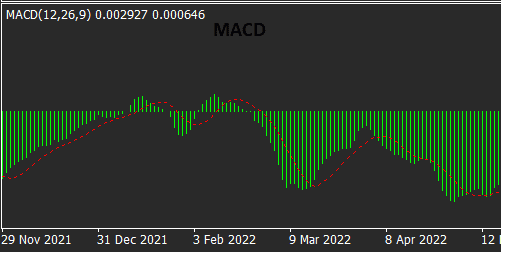
The above zig zig line is showing the MACD which means Moving Average convergence Divergence.
4. Chart Patterns
· Head and Shoulders:
The head and shoulders pattern is a widely recognized reversal pattern. It consists of three peaks, with the middle peak being the highest (the head) and the other two peaks (the shoulders) at approximately the same level. Traders consider this pattern as a signal of a potential trend reversal.
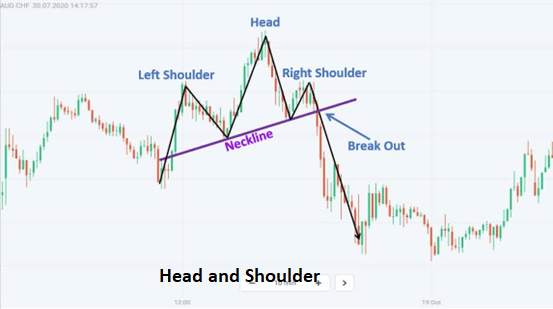
the above diagram is showing how head and shoulder is look like.
· Double Tops and Bottoms:
Double tops and bottoms are chart patterns that indicate potential trend reversals. A double top is formed when a price reaches a high level, pulls back, and then retests the same high level without breaking it. A double bottom is the opposite, with a price reaching a low level, bouncing back, and retesting the same low level without breaking it.
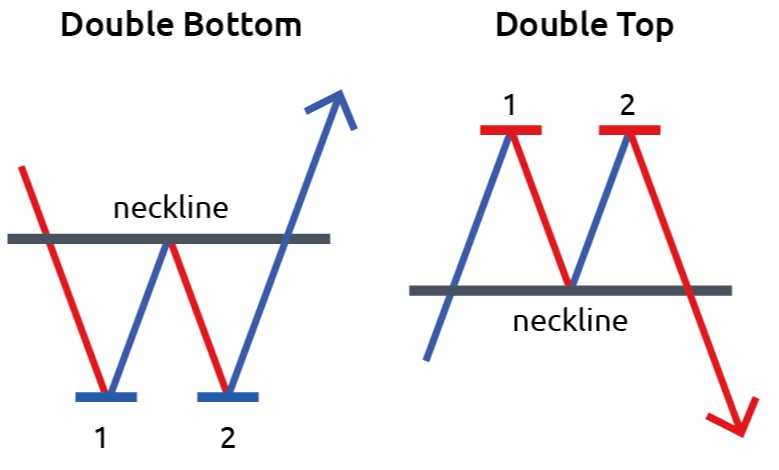
In the above diagram is showing the double top and double bottom.
· Flags and Pennants:
Flags and pennants are continuation patterns that occur after a strong price move. They represent a temporary pause in the market before the prevailing trend resumes. Traders look for breakouts from these patterns to confirm the continuation of the trend.
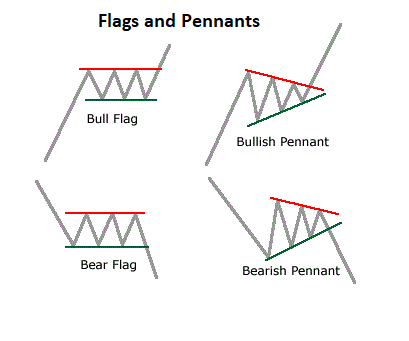
In the above it is showing the flag and Pennants pattern.
5. Average True Range (ATR)
Average True Range measures market volatility by calculating the average range between the high and low prices over a specified period. It helps traders determine the potential profit targets and stop-loss levels.
6. Fibonacci Retracement
Fibonacci retracement is a technical tool that uses horizontal lines to indicate potential support and resistance levels based on the Fibonacci sequence. Traders use these levels to identify potential areas where price corrections may end and the original trend could resume.
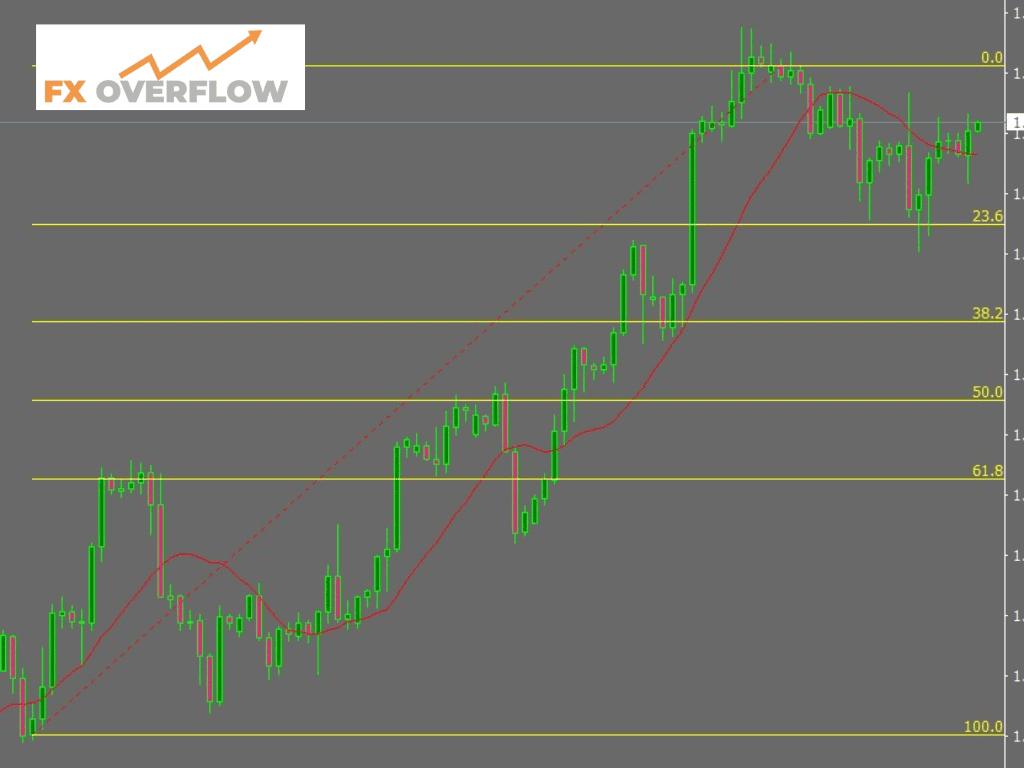
The image of Fibonacci Retracement.
7. Ichimoku Cloud
The Ichimoku Cloud is a comprehensive indicator that provides information about support and resistance levels, trend direction, and momentum. It consists of multiple components, including the Cloud, Tenkan-sen, and Kijun-sen.
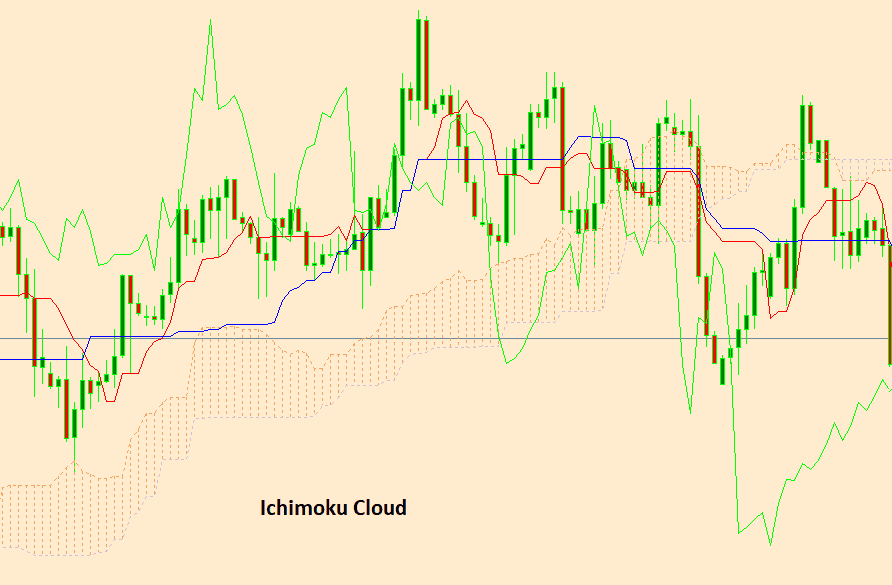
In the above diagram it is showing the IChimoku cloud
8. Pivot Points
Pivot points are significant levels derived from the previous day's price action. They help traders identify potential support and resistance levels for the current trading day. Pivot points are calculated based on the high, low, and close prices of the previous day.
9. Parabolic SAR (Stop and Reverse)
Parabolic SAR is a trend-following indicator that helps traders identify potential entry and exit points. It appears as dots above or below the price chart, indicating the trend direction.
10. Volume
Volume is a technical indicator that shows the number of shares or contracts traded during a specific period. It provides insights into market liquidity and the strength of price movements.
11. Average True Range (ATR)
Average True Range measures market volatility by calculating the average range between the high and low prices over a specified period. It helps traders determine the potential profit targets and stop-loss levels.
12. On-Balance Volume (OBV)
On-Balance Volume is a volume-based indicator that measures buying and selling pressure. It helps traders identify potential trend reversals by comparing volume and price movements.
13. Williams %R
Williams %R is a momentum oscillator that indicates overbought and oversold conditions. It measures the position of the current closing price relative to the high-low range over a specified period.
14. Chaikin Money Flow (CMF)
Chaikin Money Flow is an oscillator that combines price and volume to measure buying and selling pressure. It helps traders assess the strength of a trend and potential reversals.
15. RSI Divergence
RSI Divergence is a technique that compares the direction of price movements with the direction of the RSI indicator. It helps traders identify potential trend reversals or the continuation of a trend.
Conclusion
Technical analysis tools play a crucial role in the decision-making process of forex traders. By utilizing various indicators, chart patterns, and oscillators, traders can identify trends, reversals, and potential entry and exit points with greater accuracy. However, it is important to note that technical analysis is not foolproof and should be used in conjunction with other forms of analysis and risk management strategies.
FAQs
- What is technical analysis?
A- Technical analysis is a method of analyzing historical price data to predict future price movements in financial markets.
- Why do forex traders use technical analysis?
A- Forex traders use technical analysis to identify trends, reversals, and potential trading opportunities in the forex market.
- Are technical analysis tools 100% accurate?
A- No, technical analysis tools are not 100% accurate. They provide insights and probabilities, but market conditions can change unexpectedly.
- Can technical analysis be used in conjunction with fundamental analysis?
A- Yes, many traders combine technical analysis with fundamental analysis to gain a comprehensive understanding of the market.
- Where can I learn more about technical analysis tools?
A- There are numerous online resources, books, and courses available that provide in-depth knowledge of technical analysis tools for forex trading.
In conclusion, understanding and utilizing technical analysis tools can greatly enhance a forex trader's decision-making process. By studying trends, identifying chart patterns, and interpreting oscillators, traders can make informed trading decisions and potentially increase their chances of success in the dynamic forex market. However, it is essential to continuously learn, adapt, and combine various analysis techniques to navigate the ever-changing landscape of forex trading effectively.


Discussion