
Mastering Forex Trading: Harnessing the Power of the Fractal Indicator on MT4 Platform
The Fractal Indicator is a popular technical analysis tool used by traders to identify potential reversal points in financial markets. It is based on the concept of fractals, which are patterns that display self-similarity and occur naturally in various aspects of life, including financial markets.
Table content
- Introduction to the Fractal Indicator
- Understanding Fractals
- Fractal Geometry and Financial Markets
- The Fractal Indicator in MT4 Platform
- Using the Fractal Indicator in Trading
- Strategies with the Fractal Indicator
- Advantages and Limitations of the Fractal Indicator
- Tips for Effective Use
- Footnote
- FAQs (Frequently Asked Questions)
Introduction to the Fractal Indicator
In the world of financial trading, technical analysis plays a crucial role in understanding market movements and making informed decisions. Among the vast array of technical indicators available to traders, one that stands out for its unique properties is the Fractal Indicator. This article aims to shed light on the Fractal Indicator's concept, its significance in trading, and its application in the popular MT4 Platform.
below image of Fractal Indicator
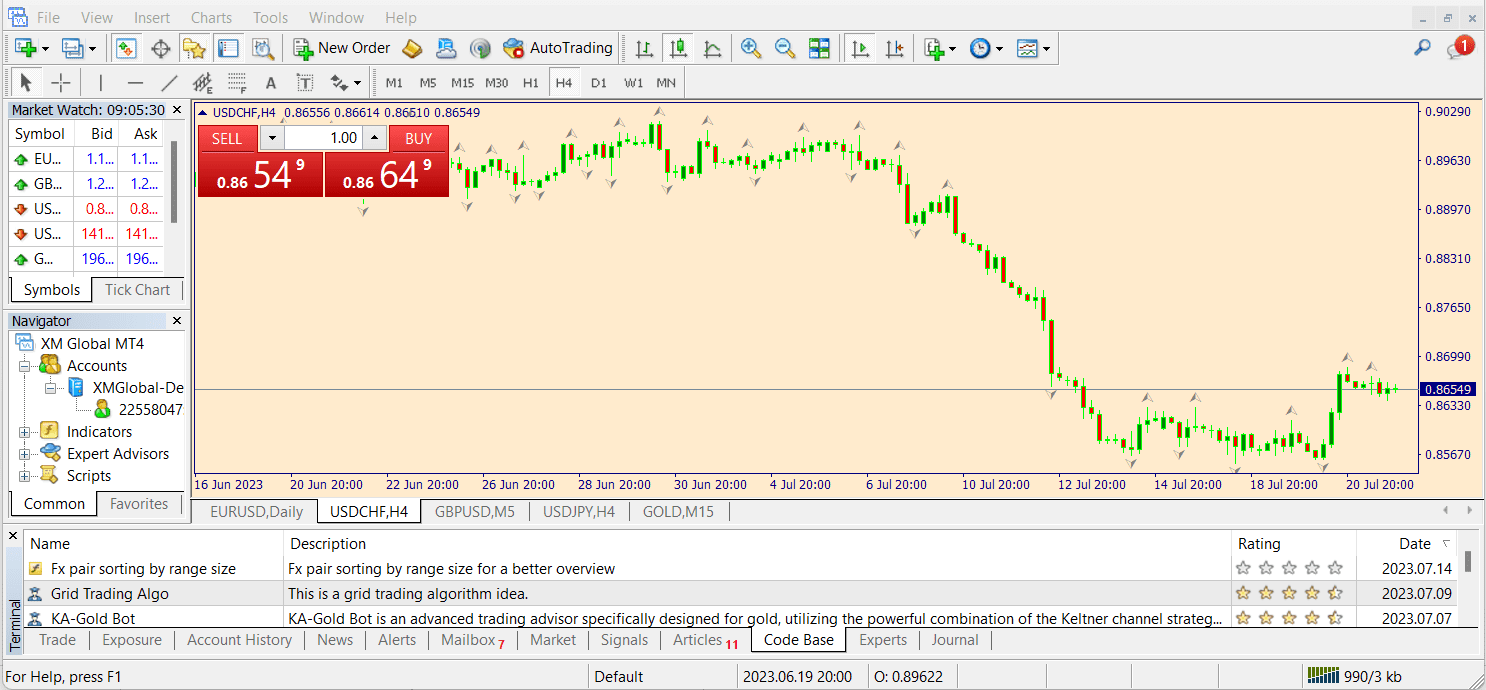
· What is the Fractal Indicator?
A fractal, in its essence, is a geometric pattern that repeats itself on different scales. The Fractal Indicator identifies these patterns on a price chart, revealing potential market turning points or pivot levels. Developed by Bill Williams, a renowned trader and author, this indicator aims to capture the inherent chaos and repetitive nature of financial markets.
· How does it work?
The Fractal Indicator operates based on certain price formations. It highlights specific candlestick patterns known as "fractals," which consist of a series of five consecutive bars. A bullish fractal occurs when the highest high is at the center with two lower highs on each side. Conversely, a bearish fractal forms when the lowest low is at the center with two higher lows flanking it.
· Importance in trading
The Fractal Indicator is highly valued by traders due to its ability to detect potential reversal points in the market. By identifying key fractal patterns, traders can better anticipate shifts in price direction, helping them enter or exit positions at favorable moments.
Understanding Fractals
Before delving further into the Fractal Indicator's application, let's gain a better understanding of fractals themselves.
· Definition of fractals
Fractals are self-repeating patterns that display similar structures, regardless of the scale at which they are observed. This property is known as self-similarity, and it is a fundamental characteristic of fractal geometry.
· Characteristics of fractals
Fractals exhibit several key characteristics:
- Self-similarity: As mentioned earlier, fractals display the same patterns on various scales.
- Infinite complexity: Fractals possess intricate structures, and no matter how much you zoom in, you will always discover more detail.
- Non-integer dimension: Unlike traditional geometry, fractals have non-integer dimensions, making them more complex to comprehend.
· Application in various fields
The concept of fractals has found applications in various disciplines beyond finance, including mathematics, physics, computer graphics, and even nature itself. From modeling coastlines to understanding the growth of tree branches, fractals offer valuable insights into the patterns and structures of the world around us.
Fractal Geometry and Financial Markets
The connection between fractals and financial markets is intriguing, as it highlights the underlying order amidst apparent market chaos.
· Fractals in financial market analysis
In the context of financial markets, fractals reflect the repetitive behavior exhibited by traders and investors, leading to identifiable patterns. These patterns, in turn, form the basis of various trading strategies and technical analysis tools.
· Identifying trends and reversals
Fractals are particularly useful in identifying trends and potential reversals. A bullish fractal, marked by the appearance of a higher high surrounded by two lower highs, signals the possibility of an uptrend reversal. On the other hand, a bearish fractal, characterized by a lower low surrounded by two higher lows, suggests a potential downtrend reversal.
· Using fractals in MT4 Platform
MetaTrader 4 (MT4) is a widely-used trading platform that offers various technical indicators, including the Fractal Indicator. Traders can seamlessly integrate the Fractal Indicator into their charts, allowing them to spot potential entry and exit points with ease.
The Fractal Indicator in MT4 Platform
MT4's user-friendly interface makes it convenient for traders to access and utilize the Fractal Indicator.
· Adding the Fractal Indicator to charts
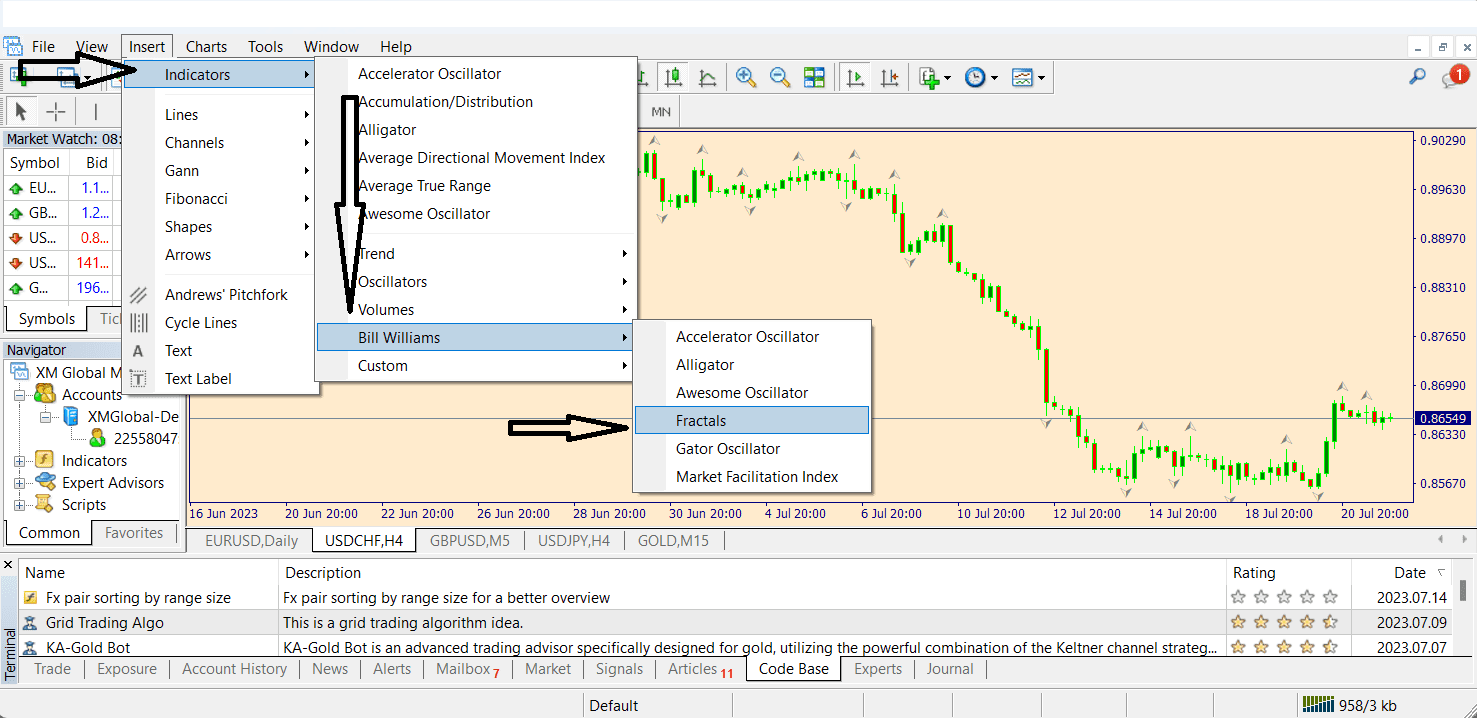
To add the Fractal Indicator to a price chart in MT4, follow these simple steps:
- Open the MT4 platform and select a financial instrument (EUR/USD, USD/JPY, USD/CHF).
- Click on "Insert" in the top menu, then choose "Indicators."
- Navigate to "Bill Williams" and select "Fractals."
Here in the below image, you can find how to add fractal indicator in MT4 platform.
· Configuring the settings
Once the Fractal Indicator is added, traders can configure its settings to suit their preferences and trading strategy. Parameters such as the number of bars to consider can be adjusted to refine the indicator's performance.
· Interpreting fractal signals
As the Fractal Indicator identifies potential reversals, traders need to interpret its signals correctly. When a valid fractal appears above the price level, it indicates a potential bearish reversal, prompting traders to consider short positions. Conversely, a fractal below the price level suggests a bullish reversal and an opportunity for long positions.
Using the Fractal Indicator in Trading
Now that we understand how the Fractal Indicator works and how to use it in MT4, let's explore its practical application in trading strategies.
· Identifying market tops and bottoms
One of the primary uses of the Fractal Indicator is to identify market tops and bottoms. When a series of higher highs appears, followed by two lower highs, it signifies a potential market top, indicating a favorable moment to exit long positions. Similarly, a sequence of lower lows followed by two higher lows suggests a market bottom, signaling a possible entry point for long positions.
· Understanding fractal breakouts
In addition to spotting reversals, fractals can assist in detecting breakout opportunities. When a fractal forms and the subsequent price movement breaks through its high or low, it indicates a breakout. Traders can capitalize on these breakouts by entering positions in the direction of the breakout.
· Setting stop-loss and take-profit levels
To manage risk effectively, traders should place stop-loss orders beyond the most recent fractal, as these levels represent potential reversal points. Additionally, setting take-profit orders based on the distance between fractals can help traders capture profits while adhering to sound risk management practices.
Strategies with the Fractal Indicator
Utilizing the Fractal Indicator in conjunction with other technical tools can enhance trading strategies further.
· Fractal breakout strategy
Combining fractals with trendlines can create a powerful breakout strategy. Traders can draw trendlines connecting the fractals and open positions when a breakout occurs, confirming the continuation of the trend.
· Fractal confirmation with other indicators
To increase the accuracy of fractal signals, traders may use other technical indicators, such as moving averages or the Relative Strength Index (RSI), to validate potential reversals or breakouts.
· Combining fractals with trendlines
Fractals and trendlines complement each other. Trendlines help identify the overall trend, while fractals offer precise entry and exit points within that trend.
Advantages and Limitations of the Fractal Indicator
Like any trading tool, the Fractal Indicator comes with its own set of advantages and limitations.
· Benefits of using fractals
- Clear visual signals: Fractals are easy to spot on price charts, providing clear signals to traders.
- Universal application: Fractals can be applied to any financial instrument and timeframe, making them versatile for traders with different preferences.
- Natural market support and resistance: Fractal levels often coincide with natural support and resistance levels, enhancing their significance in technical analysis.
· Potential drawbacks and risks
- False signals: As with any indicator, fractals can produce false signals during choppy or sideways markets, leading to potential losses.
- Subjectivity: Interpreting fractal signals involves some subjectivity, as traders may disagree on certain patterns' validity.
- Not standalone: Fractals work best when used in combination with other technical indicators and analysis techniques.
Tips for Effective Use
To make the most of the Fractal Indicator, traders should consider the following tips:
· Applying fractals in different timeframes
Fractals can be valuable across various timeframes, from short-term intraday trading to longer-term position trading. Adjusting the timeframe can provide different perspectives on market trends and reversals.
· Backtesting strategies
Before using fractals in live trading, conduct thorough backtesting on historical data to validate the effectiveness of your strategies and understand potential outcomes.
· Practicing risk management
While the Fractal Indicator aids in identifying potential trade setups, risk management remains paramount. Utilize proper position sizing and stop-loss orders to protect your capital and maintain disciplined trading habits.
Footnote
The Fractal Indicator is a powerful tool for traders seeking to analyze market trends and identify potential reversals and breakout opportunities. As a part of the MT4 Platform, it offers a user-friendly interface and can be seamlessly integrated into trading strategies. However, like any technical indicator, it is essential to use the Fractal Indicator in conjunction with other analysis tools and practice sound risk management.
For traders looking to gain an edge in the financial markets, understanding the underlying principles of fractals and their application in trading can prove to be invaluable.
FAQs (Frequently Asked Questions)
- What is the Fractal Indicator's main purpose?
- The Fractal Indicator's primary purpose is to identify potential market turning points, such as reversals and breakouts, based on specific price patterns.
- Can the Fractal Indicator be used on any financial instrument?
- Yes, the Fractal Indicator can be applied to any financial instrument, including stocks, forex, commodities, and cryptocurrencies.
- Is the Fractal Indicator suitable for day trading?
- Yes, the Fractal Indicator can be utilized for day trading, as well as swing and position trading, depending on the trader's preferences.
- How reliable are fractal signals in trading?
- Fractal signals can be reliable in trending markets, but they may produce false signals during choppy or sideways market conditions. Therefore, it is essential to consider other factors for confirmation.
- Can I solely rely on the Fractal Indicator for my trading decisions?
- While the Fractal Indicator is a valuable tool, it is not advisable to rely solely on one indicator for trading decisions. It is best used in conjunction with other technical analysis tools and risk management strategies.


Discussion