Forex trend lines: Lines drawn on charts to highlight prevailing price trends
In the fast-paced world of forex trading, understanding market trends is crucial for making informed decisions and maximizing profits. Among various analytical tools available to traders, Forex trend lines play a vital role. These lines, when drawn on charts, help highlight prevailing price trends, providing valuable insights into potential market movements. In this article, we'll delve into the significance of forex trend lines and how they can be effectively used to enhance trading strategies.
Table of Contents
1. Understanding Forex Trend Lines
2. Types of Forex Trend Lines
3. Drawing Forex Trend Lines Correctly
4. Analyzing Trend Line Breakouts
5. The Role of Trend Lines in Technical Analysis
6. Applying Forex Trend Lines in Trading Strategies
7. Psychological Aspects of Trend Lines
8. The Advantages of Forex Trend Lines
9. Disadvantages and Limitations
10. Combining Fundamental and Technical Analysis
11. Common Chart Patterns Related to Trend Lines
12. The Impact of News Events on Trend Lines
13. Trend Lines: A Trader's Best Friend
14. Footnote
15. FAQs
Understanding Forex Trend Lines
Forex trend lines are visual representations of price trends on charts. They connect swing highs or swing lows to form a straight line, outlining the direction in which the market is moving. Traders use these lines to identify potential areas of support and resistance and determine the overall trend's strength and stability.
· Identifying Trends: Uptrends and Downtrends
Before drawing trend lines, traders need to recognize the type of trend the market is currently experiencing. An uptrend is characterized by a series of higher highs and higher lows, indicating a bullish market sentiment. Conversely, a downtrend consists of lower lows and lower highs, indicating a bearish market sentiment. Recognizing these trends is crucial for accurate trend line analysis.
· Drawing Trend Lines
Drawing forex trend lines involves identifying significant swing points on a chart and connecting them in a straight line. Swing points are areas where the price temporarily reverses its direction. In an uptrend, a swing low is a potential point to start drawing a trend line, while in a downtrend, a swing high is used. Properly drawing trend lines ensures that traders capture the essence of the market movement.
Types of Forex Trend Lines
Various types of trend lines offer valuable insights into market dynamics.
· Support and Resistance Lines
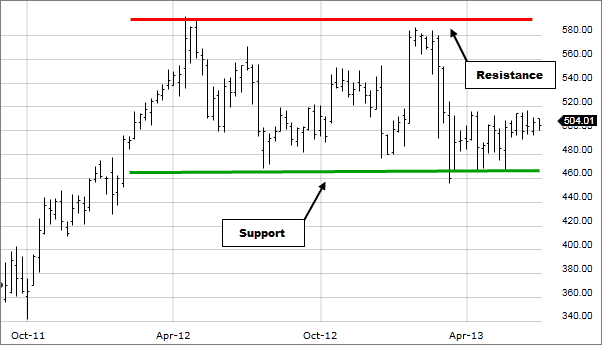
Support lines are horizontal lines drawn across swing lows that indicate potential price levels where the market may find buying interest and reverse its downward direction. On the other hand, resistance lines are horizontal lines drawn across swing highs that indicate potential price levels where the market may face selling pressure and reverse its upward direction.
· Channel Lines
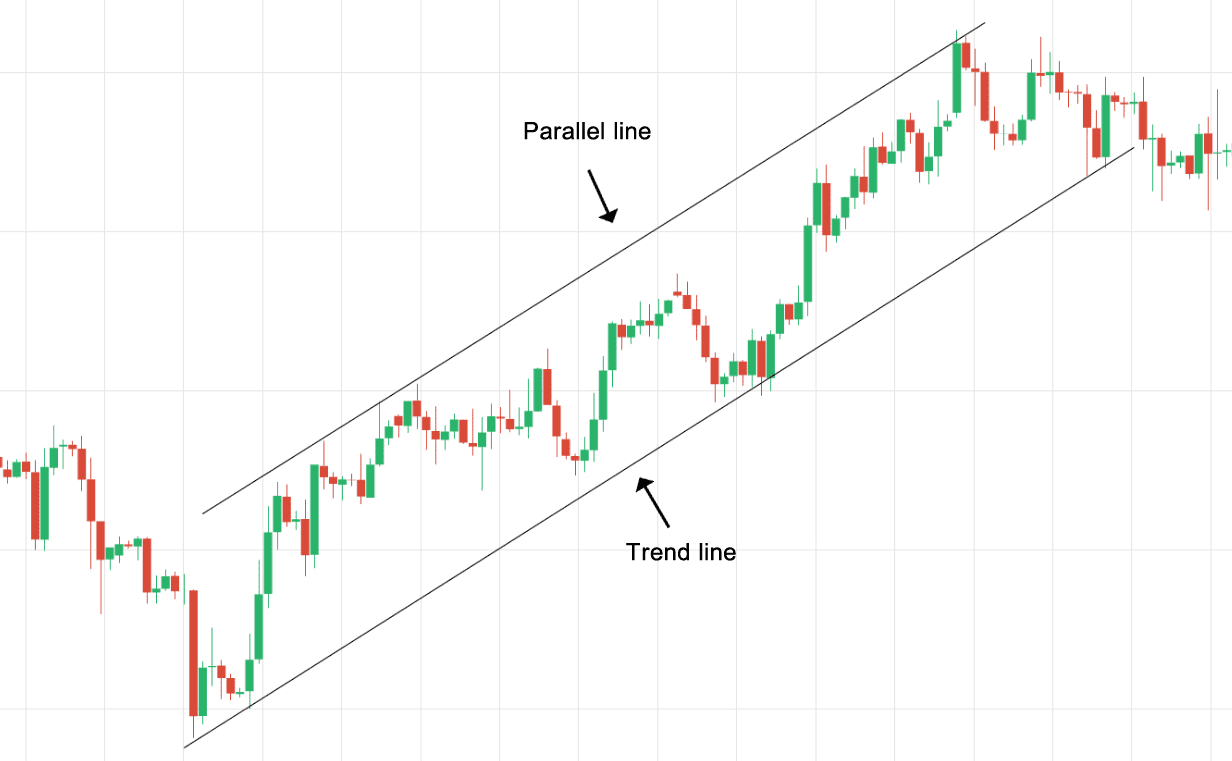
Channel lines are two parallel trend lines that encompass the price movement within a specific range. In an uptrend, the channel lines are drawn above and below the price, while in a downtrend, they are drawn below and above the price.
· Trend Channels
Trend channels are formed when both the support and resistance lines are drawn in an uptrend or downtrend. These channels provide traders with valuable information about potential entry and exit points.
Drawing Forex Trend Lines Correctly
Drawing trend lines accurately is essential for reliable market analysis.
· Selecting Significant Swing Points
Choosing relevant swing points ensures that the trend lines are meaningful and provide actionable insights. Swing points with more touches and alignment with the prevailing trend hold more significance.
· Using Multiple Timeframes
To confirm the validity of trend lines, traders should analyze multiple timeframes. A trend line that holds on various timeframes is more likely to be reliable.
· Avoiding Common Mistakes
Common mistakes, such as drawing trend lines based on personal biases or forcing lines to fit a preconceived trend, should be avoided. Keeping the process objective and systematic is crucial.
Analyzing Trend Line Breakouts
A breakout occurs when the price breaks above or below a trend line, indicating a potential trend reversal or continuation.
· Confirming Breakouts with Volume
Traders should pay attention to trading volume when analyzing trend line breakouts. High volume during a breakout provides more confidence in the trend's sustainability.
· Riding the Breakout Wave
When a trend line breakout is confirmed, traders can enter positions in the direction of the breakout, maximizing profit potential.
· Managing Risk
To mitigate risk, traders should set appropriate stop-loss orders when trading trend line breakouts.
The Role of Trend Lines in Technical Analysis
Trend lines complement other technical indicators, enhancing overall trading strategies.
· Combining Trend Lines with Other Indicators
By combining trend lines with moving averages, oscillators, or other indicators, traders gain a comprehensive view of the market.
· Fibonacci Retracements and Trend Lines
Using Fibonacci retracement levels in conjunction with trend lines helps identify potential support and resistance levels.
Applying Forex Trend Lines in Trading Strategies
Traders can employ different strategies based on trend lines.
· Trend Following Strategies
Following the trend helps traders align with the prevailing market sentiment, increasing the likelihood of successful trades.
· Counter-Trend Trading Techniques
Contrarian traders may use trend lines to identify potential reversal points and capitalize on short-term price movements.
· Trend Lines in Scalping
Scalpers can benefit from the precision offered by trend lines in quick trade executions.
Psychological Aspects of Trend Lines
The behavior of trend lines is influenced by human psychology.
· The Herd Mentality and Trend Confirmation
As more traders recognize and react to trend lines, they gain more significance, reinforcing the herd mentality.
· Fear and Greed: The Impact on Trend Line Behavior
Emotions like fear and greed can affect traders' interpretation of trend lines, leading to erratic market behavior.
· Keeping Emotions in Check
Disciplined trading and emotional control are essential when using trendlines. Emotional discipline helps traders make rational decisions based on objective analysis.
The Advantages of Forex Trend Lines
Forex trend lines offer several advantages that contribute to their popularity among traders.
· Simplicity and Effectiveness
Trend lines are simple yet powerful tools that provide clear visual cues about market trends. Traders of all experience levels can easily incorporate them into their trading strategies.
· Versatility in Various Timeframes
Whether trading on short-term intraday charts or longer-term daily or weekly charts, trend lines can be applied effectively in various timeframes.
· Back-testing and Historical Performance
Traders can test the reliability of trend lines by applying them to historical price data. Back-testing allows traders to evaluate the effectiveness of trend lines in different market conditions.
Disadvantages and Limitations
While forex trend lines are valuable tools, they come with certain limitations.
· False Breakouts
False breakouts occur when the price briefly breaks a trend line but fails to sustain the movement, leading to potential losses for traders.
· Subjectivity in Drawing Trend Lines
Since trend lines are drawn based on swing points and trader discretion, there can be some subjectivity in their interpretation.
· Market Volatility
High volatility can lead to more frequent and rapid trend line breakouts, making it challenging to manage trades effectively.
Combining Fundamental and Technical Analysis
To gain a comprehensive understanding of the forex market, traders often combine fundamental and technical analysis.
· Understanding Fundamental Factors
Factors such as economic indicators, geopolitical events, and central bank policies can significantly influence currency prices.
· Integrating Fundamentals with Technical
Traders can use fundamental analysis to identify potential catalysts and then use technical analysis, including trend lines, to time their trades more effectively.
Common Chart Patterns Related to Trend Lines
In addition to trend lines, chart patterns offer valuable insights into market behavior.
· Head and Shoulders Pattern
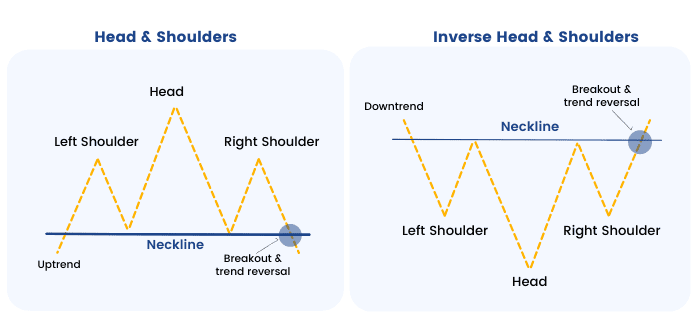
The head and shoulders pattern is a reversal pattern that may form at the end of an uptrend, signaling a potential downtrend.
· Triangles and Wedges
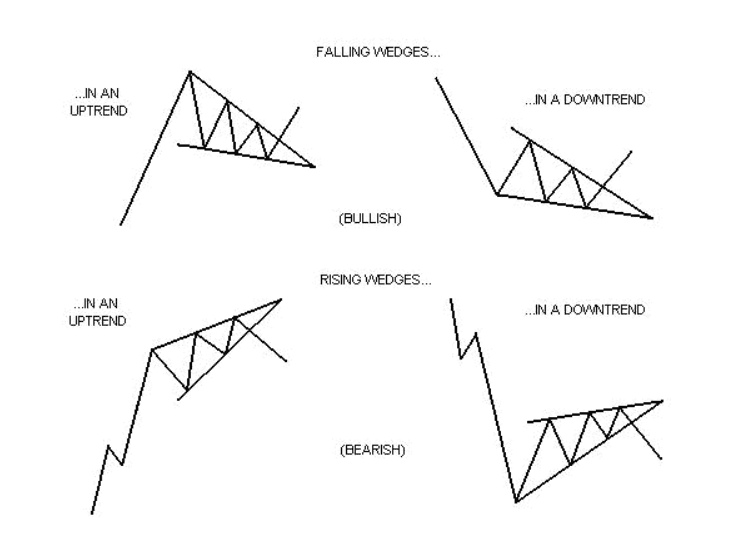
Triangles and wedges are consolidation patterns that can break in either direction, providing trading opportunities.
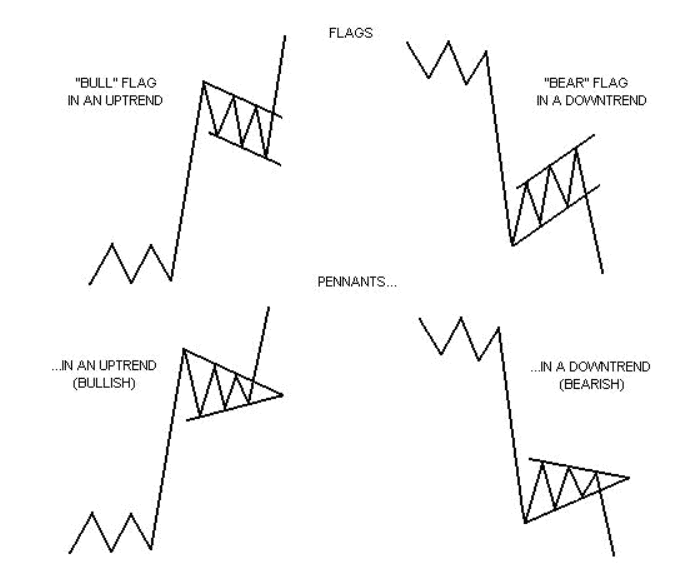
· Flags and Pennants
Flags and pennants are continuation patterns that occur after a strong price movement, indicating a potential resumption of the trend.
The Impact of News Events on Trend Lines
Major news events can have a significant impact on trend lines and overall market sentiment.
· Navigating High-Impact News Releases
Traders need to be cautious during high-impact news releases, as they can cause sudden and unpredictable price movements.
· Temporary vs. Long-term Trend Shifts
Some news events may cause temporary disruptions to trends, while others can lead to long-term trend shifts.
Trend Lines: A Trader's Best Friend
Mastering the art of trend line analysis can significantly enhance a trader's success rate.
· Building Trading Confidence
As traders gain experience and proficiency in using trend lines, their confidence in making trading decisions increases.
· Continuous Learning and Adaptation
Market conditions change, and traders must continuously learn, adapt, and refine their strategies, including trend line analysis.
Footnote
In Summary, Forex trend lines are powerful tools that provide valuable insights into market trends and potential trading opportunities. Understanding the different types of trend lines, drawing them correctly, and analyzing trend line breakouts are essential skills for any trader seeking success in the forex market. By combining technical analysis, including trend lines, with fundamental analysis, traders can develop well-rounded strategies to navigate the complexities of the currency market successfully.
FAQs
- What are forex trend lines?
Forex trend lines are lines drawn on charts to highlight prevailing price trends, helping traders identify potential support and resistance levels.
- How do I draw trend lines accurately?
To draw trend lines accurately, select significant swing points and use multiple timeframes to confirm their validity.
- What is the role of trend lines in technical analysis?
Trend lines complement other technical indicators, providing traders with a comprehensive view of market dynamics.
- What are some common chart patterns related to trend lines?
Common chart patterns include the head and shoulders pattern, triangles, wedges, flags, and pennants.
- How do I use trend lines in cryptocurrency trading?
Trend lines are relevant in cryptocurrency trading, but traders should be cautious due to the market's high volatility.


Discussion