
Forex Trading Strategies with RSI: Incorporating the Relative Strength Index Indicator in Trading Decisions
Forex trading has become increasingly popular over the years, attracting traders from all walks of life. The potential for profit in the currency markets has enticed both seasoned investors and newcomers. As the market constantly evolves, traders are always on the lookout for effective strategies that can help them make informed decisions. One such tool that has gained prominence is the Relative Strength Index (RSI) indicator.
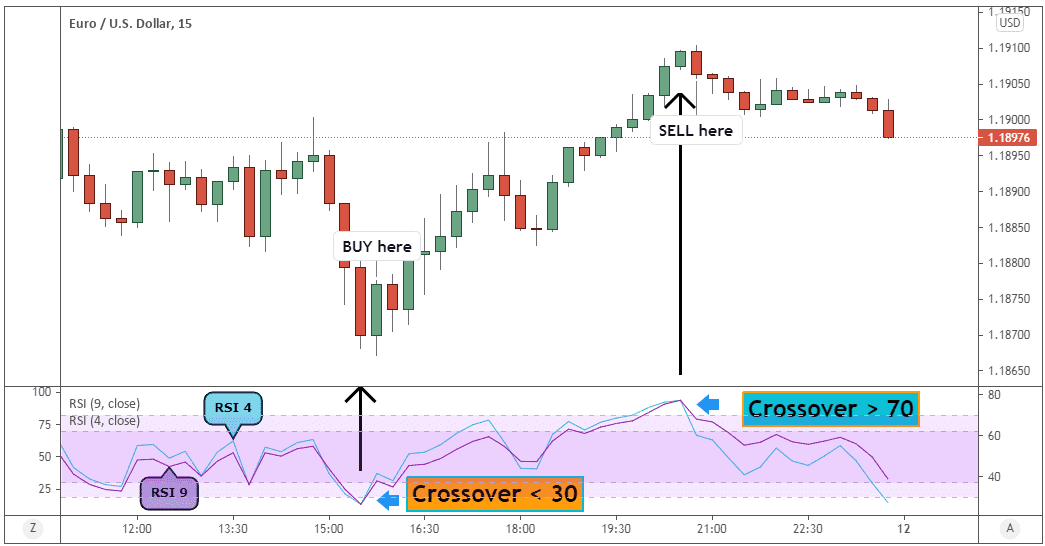
Table Content
1. Understanding RSI
2. Forex Trading Strategies with RSI
3. Real-Life Examples
4. Tips for Using RSI Effectively
5. Advantages and Limitations of RSI
6. Footnote
7. FAQs
Understanding RSI
The Relative Strength Index, or RSI, is a momentum oscillator that measures the speed and change of price movements. It compares the magnitude of recent gains to recent losses, indicating whether a currency pair is overbought or oversold. RSI values range from 0 to 100, with readings above 70 indicating overbought conditions and readings below 30 indicating oversold conditions.
To calculate RSI, the average of the price's up-closes and down-closes over a specified period is determined. The RSI equation is as follows:
RSI = 100 - [100 / (1 + (Average Gain / Average Loss))]
Interpreting RSI readings is crucial. High RSI values suggest strong upward momentum, while low RSI values indicate strong downward momentum.
Forex Trading Strategies with RSI
Strategy 1: RSI Divergence
RSI divergence occurs when the RSI indicator moves in the opposite direction of the price action. It suggests a potential reversal in the price trend. For instance, if the price is making higher highs, but the RSI is making lower highs, it indicates a bearish divergence. Conversely, a bullish divergence occurs when the price makes lower lows, but the RSI makes higher lows.
Strategy 2: RSI Overbought and Oversold Levels
Traders often use RSI to identify overbought and oversold conditions. When the RSI reading goes above 70, the currency pair is considered overbought, and a correction or downward movement may follow. Conversely, when the RSI drops below 30, the currency pair is considered oversold, and a potential upward correction may occur.
Strategy 3: RSI Trendline Breaks
Drawing trendlines on the RSI chart can provide valuable insights. A break of the RSI trendline can signal a trend reversal, similar to traditional price trendlines.
Strategy 4: RSI and Moving Averages
Combining RSI with moving averages can enhance trading decisions. For instance, when the RSI crosses above a moving average, it may indicate a bullish trend, and vice versa for a bearish trend.
Strategy 5: RSI and Support/Resistance Levels
RSI can be used in conjunction with support and resistance levels to confirm potential entry and exit points. When RSI readings align with key support or resistance areas, it strengthens the trading signal.
Real-Life Examples
To better understand how RSI strategies work, let's consider some real-life examples:
- RSI Divergence Example: During an uptrend, the price of a currency pair makes higher highs, but the RSI indicator forms lower highs. This divergence suggests a potential trend reversal, prompting traders to consider short positions.
- Overbought and Oversold Example: The RSI reading of a currency pair reaches 75, indicating overbought conditions. Traders may decide to take profits on their long positions, anticipating a downward correction.
- RSI Trendline Break Example: The RSI breaks a downward trendline while the price is still declining. This breakout might signal an upcoming trend reversal, leading traders to prepare for a potential upward movement.
- RSI and Moving Averages Example: The RSI crosses above a 50-day moving average, coinciding with the price crossing above the same moving average. This dual confirmation may encourage traders to enter long positions.
- RSI and Support/Resistance Example: The RSI reaches oversold levels near a significant support area. Traders might interpret this as a possible buying opportunity.
Tips for Using RSI Effectively
- Setting Appropriate Timeframes: Adjust the RSI period based on your trading style and the market's volatility. Short-term traders might use a lower period, while long-term traders might opt for a higher period.
- Combining RSI with Other Indicators: RSI works well when used in conjunction with other technical indicators, such as moving averages or trendlines, to validate signals.
- Risk Management and Stop-Loss Placement: Set stop-loss orders to protect your capital in case the trade goes against your expectations. Avoid risking a significant portion of your trading account on a single trade.
Advantages and Limitations of RSI
Advantages:
- Helps identify overbought and oversold conditions
- Provides early signals for potential trend reversals
- Easy to use and interpret
Limitations:
- False signals can occur during choppy market conditions
- RSI may stay in overbought or oversold territories for extended periods during strong trends
Footnote
Incorporating the Relative Strength Index (RSI) indicator in Forex trading strategies can be a valuable tool for traders seeking to make informed decisions. By understanding RSI readings and using various strategies like divergence, overbought/oversold levels, trendline breaks, and combining RSI with other indicators, traders can increase their chances of success in the dynamic world of currency trading.
FAQs
Q: What is the ideal RSI period for Forex trading?
A: The ideal RSI period depends on your trading style and the market's volatility. Short-term traders often use a lower period, such as 14, while long-term traders might opt for a higher period, like 28 or 50.
Q: Can RSI be used for other financial instruments besides Forex?
A: Yes, RSI can be used for various financial instruments, including stocks, commodities, and cryptocurrencies, in addition to Forex.
Q: Is RSI a standalone trading strategy?
A: RSI is a powerful tool but is usually more effective when used in conjunction with other technical indicators and price action analysis.
Q: Can RSI be used during ranging markets?
A: RSI may generate false signals during ranging or sideways markets, so it is essential to exercise caution and consider other indicators in such conditions.
Q: Should I rely solely on RSI for making trading decisions?
A: Relying solely on one indicator is not recommended. It is best to combine RSI with other tools and conduct comprehensive market analysis before making trading decisions.


Discussion