Forex Trading Strategies with Bollinger Bands: Using Bollinger Bands as a Volatility Indicator
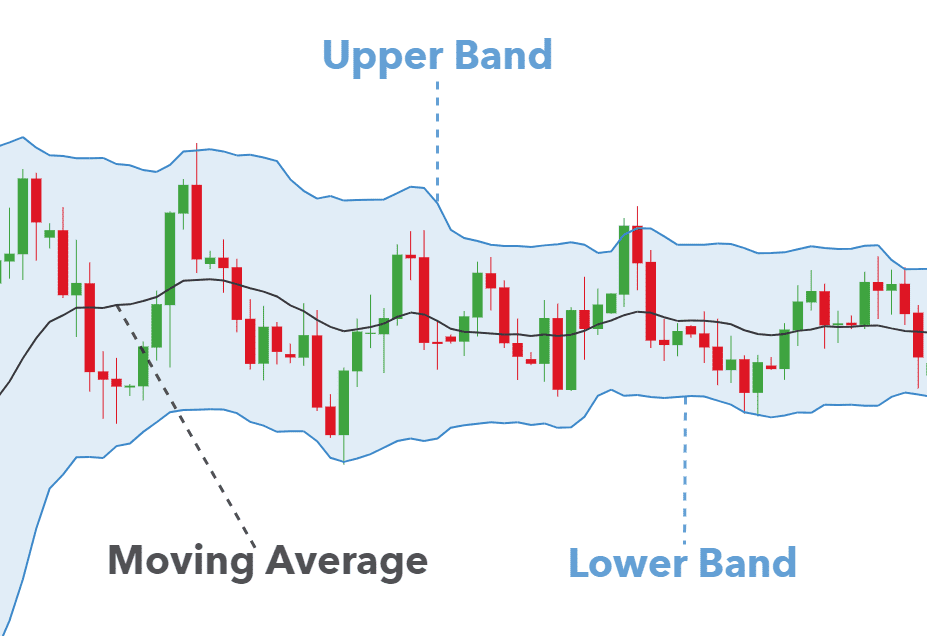
Bollinger Bands are a popular technical analysis tool used by forex traders to gauge market volatility. Developed by John Bollinger in the 1980s, these bands consist of a moving average (usually the 20-day SMA) and two standard deviations above and below the moving average. The width of the bands expands and contracts based on market volatility, making them an excellent tool for traders seeking to identify potential price breakouts and reversals.

Table of Content
Table of Content
1. Understanding Bollinger Bands
2. Using Bollinger Bands for Volatility
3. Applying Bollinger Bands on Different Timeframes
4. Combining Bollinger Bands with Other Indicators
5. Back-testing and Optimization
6. Keeping a Trading Journal
7. Emotional Discipline in Forex Trading
8. Conclusion
9. FAQs (Frequently Asked Questions)
Understanding Bollinger Bands
- What are Bollinger Bands?
Bollinger Bands are dynamic indicators that provide valuable insights into market volatility and price movements. The upper and lower bands act as dynamic support and resistance levels, guiding traders in making buy or sell decisions.
- How Bollinger Bands Work?
The middle band represents the moving average, while the upper and lower bands move in response to market volatility. During periods of high volatility, the bands widen, and during low volatility, they contract.
- Calculating Bollinger Bands?
To calculate Bollinger Bands, you need to first compute the moving average (MA) of the chosen period. The upper band is then derived by adding two standard deviations to the MA, and the lower band is calculated by subtracting two standard deviations from the MA.
Using Bollinger Bands for Volatility
- Identifying Volatility with Bollinger Bands?
Bollinger Bands' ability to adapt to market conditions makes them effective tools for identifying periods of high and low volatility. When the bands widen, it indicates increased volatility, suggesting potential trading opportunities.
- Trading Strategies using Bollinger Bands for Volatility
Traders can use Bollinger Bands to implement volatility-based strategies like Bollinger Squeeze, Bollinger Breakout, and Bollinger Spike. These strategies involve trading breakouts when the bands contract and reversals when the bands expand.
Applying Bollinger Bands on Different Timeframes
- Scalping with Bollinger Bands
Scalpers can utilize Bollinger Bands on short timeframes to identify quick price movements and capitalize on small price fluctuations.
- Day Trading with Bollinger Bands
Day traders can use Bollinger Bands on intraday charts to identify potential trend reversals and breakout opportunities.
- Swing Trading with Bollinger Bands
Swing traders can incorporate Bollinger Bands on medium-term charts to capture price swings during trending markets.
- Position Trading with Bollinger Bands
Position traders can apply Bollinger Bands on long-term charts to make informed decisions based on long-term market trends.
Combining Bollinger Bands with Other Indicators
- MACD and Bollinger Bands Strategy
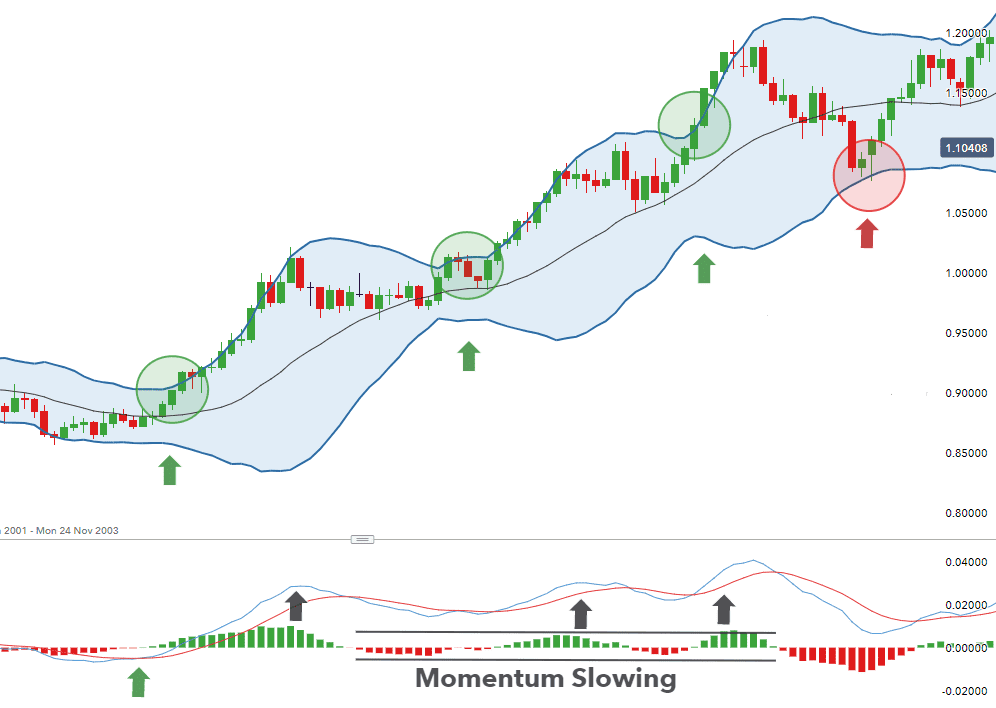
The MACD and Bollinger Bands strategy is a popular technical analysis approach used by traders to identify potential trading opportunities in financial markets, particularly in stocks, forex, and cryptocurrencies. Both the MACD (Moving Average Convergence Divergence) and Bollinger Bands are indicators that provide insights into the price trends and volatility of an asset.

- MACD and Bollinger Bands Strategy:
The strategy involves using both the MACD and Bollinger Bands indicators together to make trading decisions. Here's a basic outline of how the strategy might be employed:
1. Identifying Trend and Momentum: - Use the MACD to identify the overall trend and momentum of the asset. A bullish MACD crossover (MACD line crossing above the signal line) suggests potential upward momentum, while a bearish crossover indicates potential downward momentum.
2. Confirmation with Bollinger Bands: - Wait for the price to approach the upper Bollinger Band in a bullish scenario or the lower Bollinger Band in a bearish scenario.
If the price is approaching the upper band during a bullish MACD crossover, it may indicate a strong upward trend. Similarly, if the price is near the lower band during a bearish MACD crossover, it could signal a strong downward trend.
3. Entry and Exit Points: -
I) For long (buy) positions: Consider entering when the MACD confirms a bullish trend and the price is near the lower Bollinger Band. This combination suggests a potential reversal from a downward trend.
II) For short (sell) positions: Consider entering when the MACD confirms a bearish trend and the price is near the upper Bollinger Band. This combination suggests a potential reversal from an upward trend.
4. Risk Management: - Place stop-loss orders to limit potential losses if the trade goes against your expectations. Consider setting profit targets to secure gains as the price moves in your favor.
- RSI and Bollinger Bands Strategy
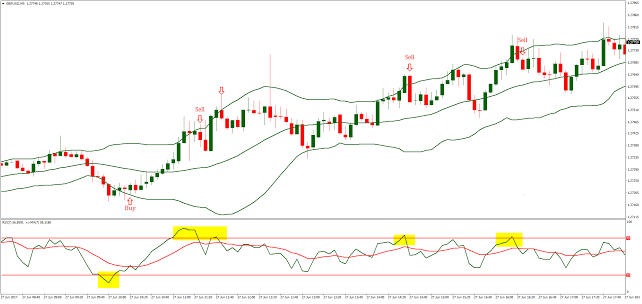
The RSI (Relative Strength Index) and Bollinger Bands strategy is another widely used approach in technical analysis for identifying potential trading opportunities. This strategy combines the insights provided by the RSI indicator and Bollinger Bands to make informed trading decisions in financial markets.

- RSI and Bollinger Bands Strategy:
Here's how the RSI and Bollinger Bands strategy can be employed:
1. Identify Overbought and Oversold Conditions: -Use the RSI to identify overbought conditions (RSI above 70) and oversold conditions (RSI below 30).
2. Confirmation with Bollinger Bands: - When the price is in an overbought condition (RSI > 70), wait for the price to touch or move above the upper Bollinger Band. This might suggest that the price is extended and could be due for a reversal or pullback.
When the price is in an oversold condition (RSI < 30), watch for the price to touch or move below the lower Bollinger Band. This could indicate that the price is excessively low and might be poised for a rebound.
3. Entry and Exit Points:
I) For overbought conditions: Consider entering a short (sell) position when the price moves above the upper Bollinger Band and the RSI is above 70. This suggests potential for a downward reversal.
II) For oversold conditions: Consider entering a long (buy) position when the price moves below the lower Bollinger Band and the RSI is below 30. This indicates potential for an upward reversal.
Risk Management: - Implement stop-loss orders to manage potential losses if the trade goes against your expectations. Set profit targets to secure gains as the trade moves in your favor.
Back-testing and Optimization
Before implementing Bollinger Bands in live trading, traders should back-test their strategies to evaluate their performance historically and optimize them for better results.
Keeping a Trading Journal
Maintaining a trading journal helps traders track their performance, identify strengths and weaknesses, and improve their trading strategies over time.
Emotional Discipline in Forex Trading
Emotional discipline is essential for successful forex trading. Traders can use Bollinger Bands to create a systematic and objective trading approach, reducing the impact of emotions on their decisions.
Footnote
Bollinger Bands are versatile tools that can significantly enhance a trader's understanding of market volatility and price action. By integrating Bollinger Bands into various trading strategies and combining them with other indicators, traders can make informed decisions and improve their overall trading performance.
FAQs (Frequently Asked Questions)
Q: How can Bollinger Bands help identify market reversals?
A: Bollinger Bands widen during high volatility, signaling potential reversals when the bands contract.
Q: Can Bollinger Bands be used for long-term trading?
A: Yes, Bollinger Bands can be applied on long-term charts for position trading.
Q: What are some common Bollinger Bands strategies for day traders?
A: Day traders can use Bollinger Squeeze and Bollinger Breakout strategies.
Q: Is back-testing necessary before using Bollinger Bands in live trading?
A: Yes, back-testing is crucial to evaluate strategy performance and identify potential issues.
Q: How can I improve emotional discipline in forex trading?
A: Using Bollinger Bands to create systematic trading rules can help reduce emotional decision-making.


Discussion