
Forex Trading Strategies Using the RSI Indicator: Techniques for Trading with the Relative Strength Index
In the complex world of forex trading, traders are always on the lookout for reliable indicators that can help them make informed decisions and achieve profitable outcomes. The Relative Strength Index (RSI) is one such indicator that has gained immense popularity among traders due to its ability to provide insights into market trends and potential reversals. In this article, we will delve into the RSI indicator, understand its mechanics, and explore effective trading strategies that can be employed to enhance your forex trading endeavors.
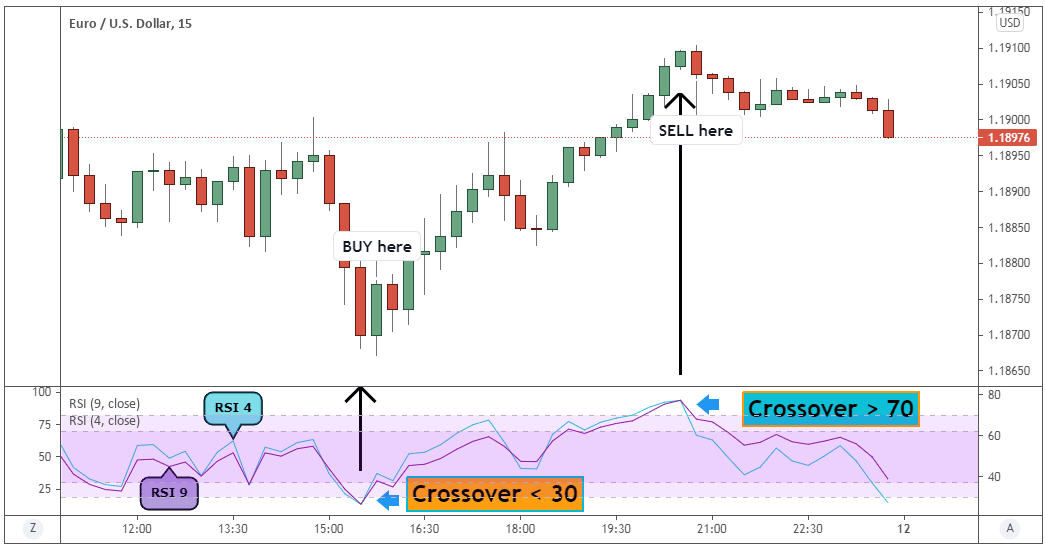
Table Content
I. Understanding the RSI Indicator
II. RSI-Based Trading Strategies
1. RSI Divergence Strategy
2. Overbought and Oversold Strategy
3. RSI Trendline Break Strategy
4. RSI and Moving Averages
5. RSI Range Strategy
6. RSI and Support/Resistance Levels
III. Risk Management and Considerations
IV. Footnote
Understanding the RSI Indicator
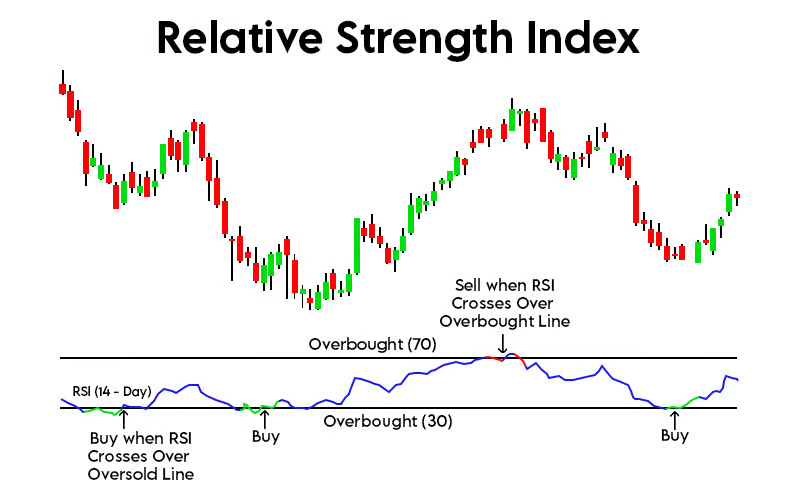
The Relative Strength Index, developed by J. Welles Wilder, is a momentum oscillator that measures the speed and change of price movements. It oscillates between 0 and 100 and is typically displayed as a line graph beneath a forex price chart. The RSI indicator is used to identify overbought and oversold conditions in the market, offering traders valuable information about potential trend reversals.
The RSI is calculated using the following formula:
RSI = 100 - (100 / (1 + RS))
Where RS (Relative Strength) is the average of x days' up closes divided by the average of x days' down closes.
An RSI value above 70 generally indicates that a currency pair is overbought, suggesting a potential upcoming reversal to the downside. Conversely, an RSI value below 30 suggests an oversold condition and a potential reversal to the upside. However, it's important to note that overbought and oversold conditions do not necessarily guarantee an immediate reversal; they merely highlight that a potential reversal might be on the horizon.
RSI-Based Trading Strategies
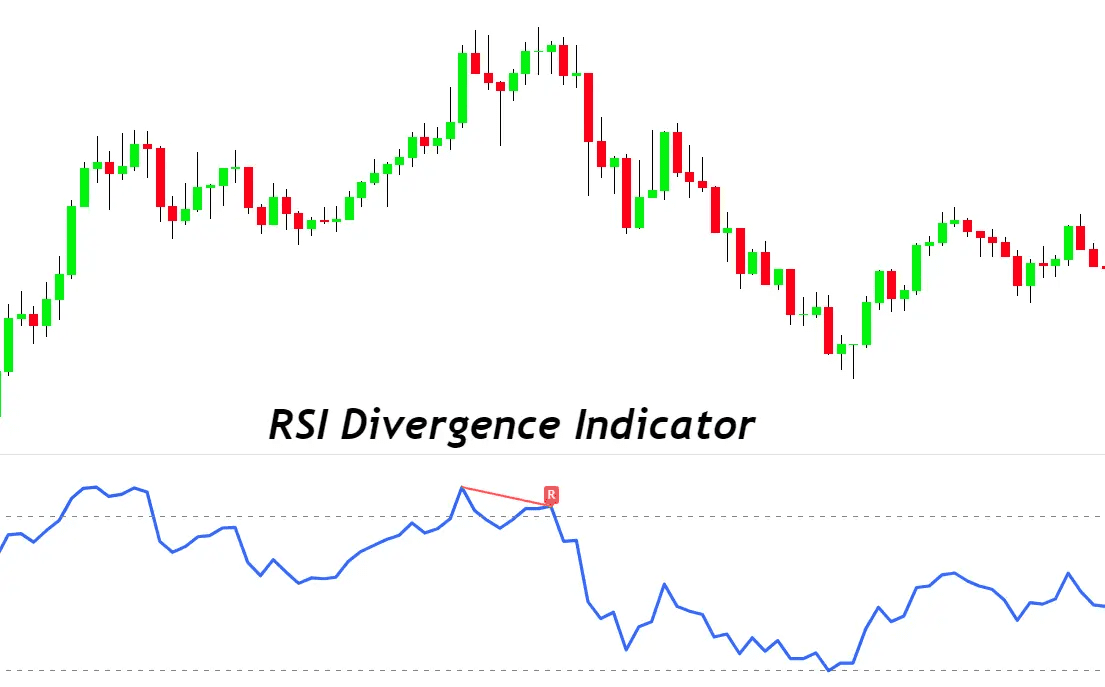
1. RSI Divergence Strategy:
Divergence occurs when the direction of the price trend and the direction of the RSI indicator diverge. If the price is making higher highs but the RSI is making lower highs, this is called bearish divergence and could indicate a potential reversal to the downside. On the other hand, if the price is making lower lows but the RSI is making higher lows, this is called bullish divergence and could indicate a potential reversal to the upside. This strategy helps traders anticipate trend changes before they become apparent in the price chart.
2. Overbought and Oversold Strategy:
As mentioned earlier, RSI values above 70 indicate overbought conditions, while RSI values below 30 indicate oversold conditions. Traders can use these levels to identify potential entry points for their trades. For instance, in an uptrend, if the RSI crosses above 70 and then drops back below it, this could signal a potential bearish reversal, and traders might consider opening short positions.
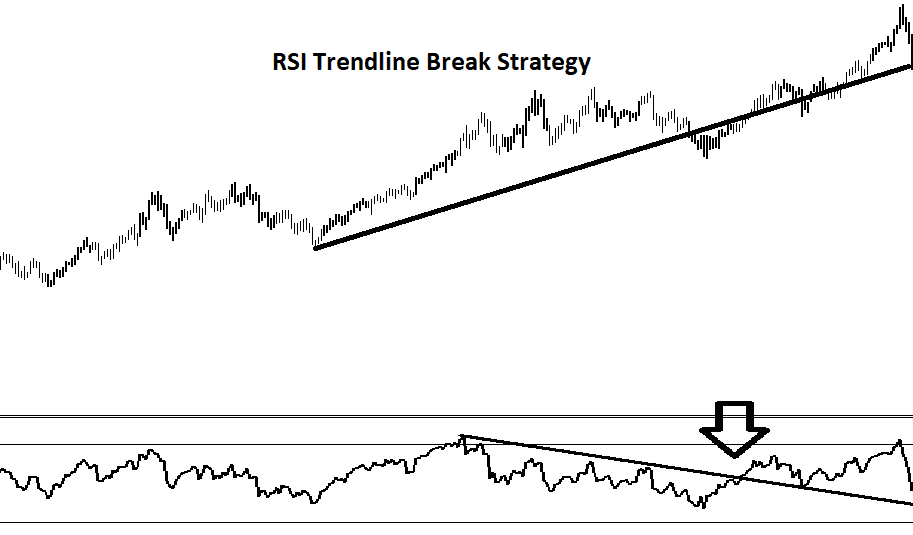
3. RSI Trendline Break Strategy:
Traders can draw trendlines on the RSI indicator itself, just like they do on price charts. If the RSI breaks above a trendline, it could indicate a strong uptrend, and if it breaks below a trendline, it could signal a potential downtrend. This strategy helps traders identify the strength and sustainability of a trend.
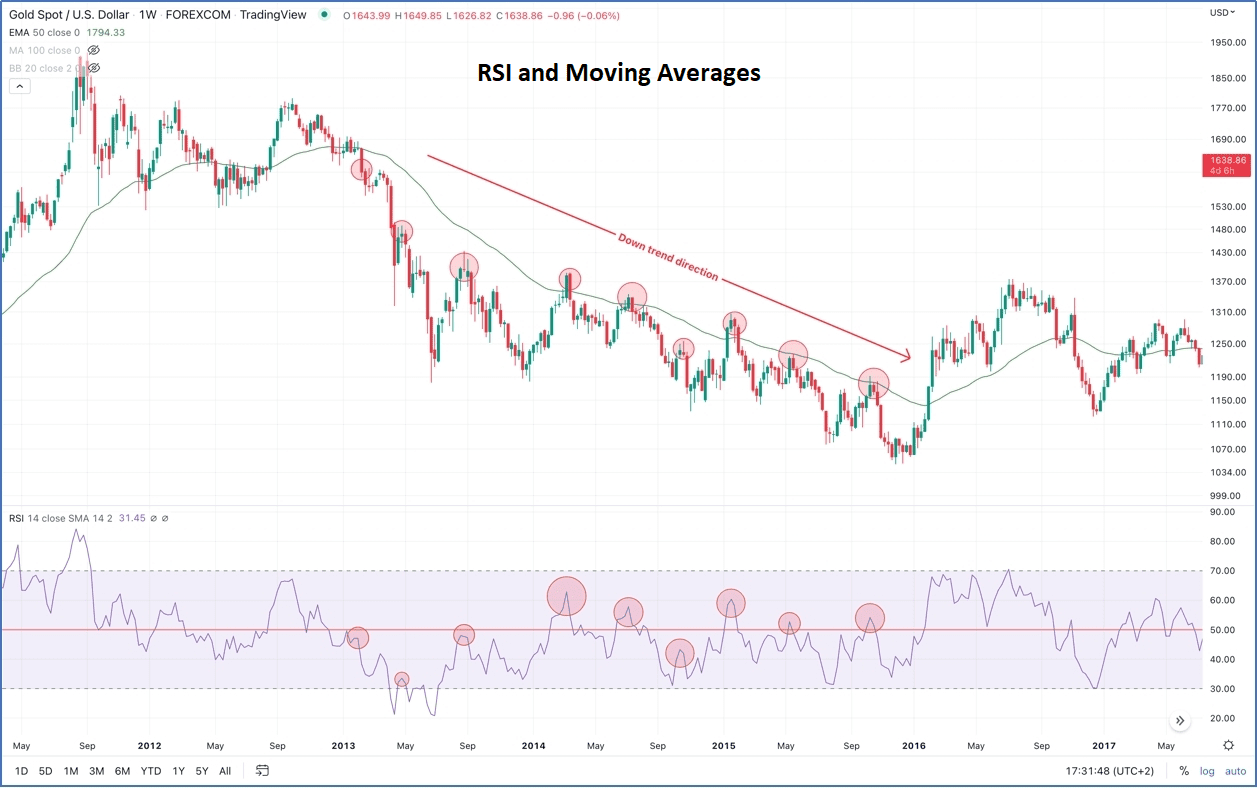
4. RSI and Moving Averages:
Combining the RSI indicator with moving averages can offer more robust trading signals. For instance, traders can use a moving average crossover strategy along with RSI confirmation. If a short-term moving average crosses above a long-term moving average and the RSI is above 50, it could signal a strong uptrend and provide a potential entry point for a long trade.
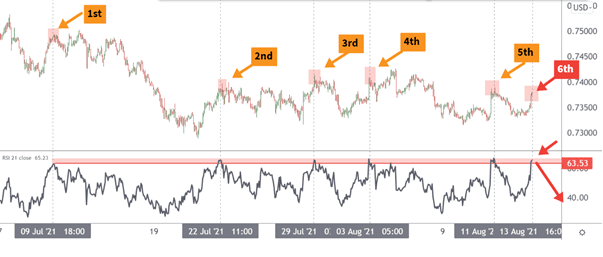
5. RSI Range Strategy:
Instead of relying solely on overbought and oversold levels, traders can establish a range for the RSI that suits the specific currency pair's characteristics. For example, rather than using 70 and 30 as the overbought and oversold levels, a trader might choose to use 80 and 20 for a highly volatile currency pair. This allows for more flexibility and adapts the strategy to the market's behavior.
6. RSI and Support/Resistance Levels:
Traders can combine RSI readings with key support and resistance levels on the price chart. If the RSI is in overbought territory and the price is approaching a strong resistance level, it could present a potential opportunity to enter a short trade. Conversely, if the RSI is in oversold territory and the price is near a significant support level, it might be an appropriate time to consider a long trade.

Risk Management and Considerations
While the RSI indicator can be a powerful tool for forex traders, it's crucial to exercise proper risk management and consider its limitations. Like any technical indicator, the RSI is not infallible and can provide false signals. Traders should avoid relying solely on the RSI and instead combine it with other indicators, chart patterns, and fundamental analysis.
Moreover, the forex market can be highly volatile, and trends can change rapidly. As a result, traders should use the RSI in conjunction with other tools to confirm signals and reduce the likelihood of entering trades based on misleading information.
Footnote
The Relative Strength Index (RSI) is a versatile indicator that holds the potential to enhance a forex trader's decision-making process. By identifying overbought and oversold conditions, divergences, and trendline breaks, traders can gain valuable insights into potential trend reversals and entry points. However, it's important to remember that no single indicator guarantees success in the forex market. Combining the RSI with other technical and fundamental analysis tools, along with proper risk management, is essential for achieving consistent and profitable trading outcomes. As the forex market continues to evolve, traders who master the art of incorporating the RSI indicator into their strategies may find themselves better equipped to navigate the complexities of currency trading.


Discussion