
Forex Trading Strategies Using Renko Charts: Mastering Techniques for Interpreting Renko Chart Patterns
The world of forex trading is a dynamic and complex arena, where traders employ a variety of tools and strategies to gain an edge in the market. Among these tools, Renko charts have gained popularity for their unique approach to charting price movements. Renko charts provide a distinct perspective on price action, focusing solely on price changes while filtering out the noise of time and volume. In this article, we will delve into the intricacies of forex trading strategies using Renko charts and explore the techniques for interpreting Renko chart patterns.
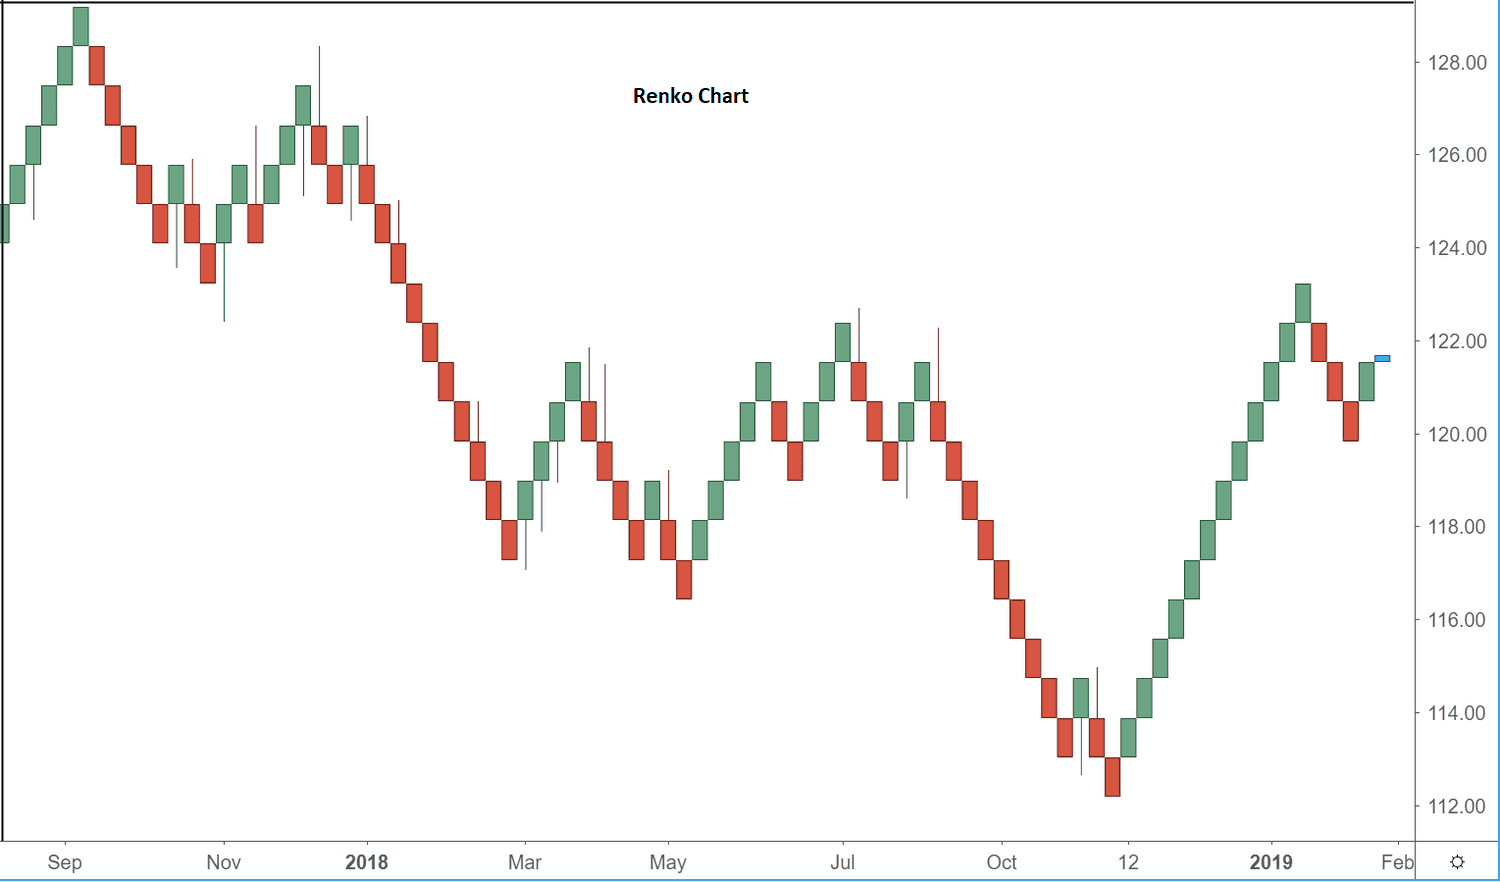
Table Content
I. Understanding Renko Charts: A Brief Overview
II. Advantages of Renko Charts
1) Clarity in Price Trends
2) Reduced Market Noise
3) Smoother Patterns
4) Elimination of Time Factor
III. Forex Trading Strategies Using Renko Charts
1. Trend Identification Strategy
2. Support and Resistance Strategy
3. Breakout Strategy
IV. Techniques for Interpreting Renko Chart Patterns
1. Brick Size Selection
2. Combining Renko Charts with Other Indicators
3. Identifying Patterns
4. Monitoring Price Action
V. Footnote
Understanding Renko Charts: A Brief Overview
Renko charts have their roots in Japan, where the word "Renko" translates to "brick." This translation aptly captures the essence of these charts, which consist of blocks (or "bricks") that represent a fixed price movement. Unlike traditional candlestick or bar charts, which rely on time intervals, Renko charts concentrate solely on price movements and disregard the time element.
Each Renko brick is plotted vertically and can be either bullish or bearish, depending on the direction of price movement. The size of the brick is predetermined, and traders can adjust this size to suit their trading style and preferences. If the price moves by a specified amount in an upward direction, a new bullish brick is drawn above the previous one. Conversely, if the price moves downward by the predetermined value, a bearish brick is plotted below the last one.
Advantages of Renko Charts
Renko charts offer several advantages that make them appealing to forex traders:
1) Clarity in Price Trends: Renko charts provide a clear visual representation of price trends by eliminating minor fluctuations. This clarity can assist traders in identifying major price movements and trends without the noise caused by constant price oscillations.
2) Reduced Market Noise: As Renko charts focus solely on significant price movements, they filter out market noise, such as small price spikes and reversals. This feature can lead to more accurate analysis and decision-making.
3) Smoother Patterns: Renko charts can help traders identify smoother and more consistent chart patterns, making it easier to spot key support and resistance levels, trendlines, and other technical formations.
4) Elimination of Time Factor: By disregarding time intervals, Renko charts eliminate the impact of irregular trading hours and market gaps, allowing traders to focus exclusively on price movements.
Forex Trading Strategies Using Renko Charts
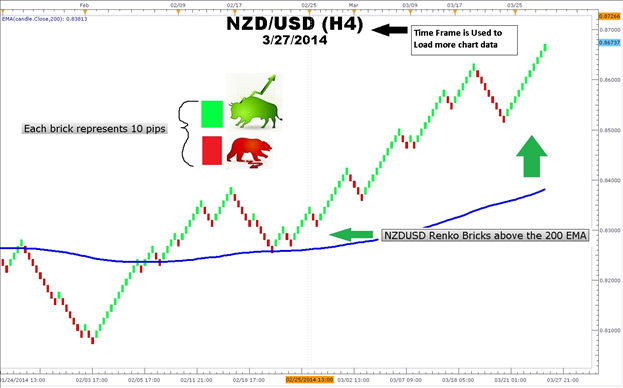
1. Trend Identification Strategy:
One of the most popular forex trading strategies using Renko charts is trend identification. Renko charts excel at capturing and displaying trends due to their ability to filter out market noise. Traders can identify trends by observing the consecutive bullish or bearish bricks on the chart.
To execute this strategy, traders can:
a) Identify the prevailing trend by observing the direction of the bricks (upward for bullish trend and downward for bearish trend).
b) Look for instances of trend reversals or significant price movements that lead to brick changes in the opposite direction.
c) Use additional technical indicators, such as moving averages or trendlines, to confirm the identified trend.
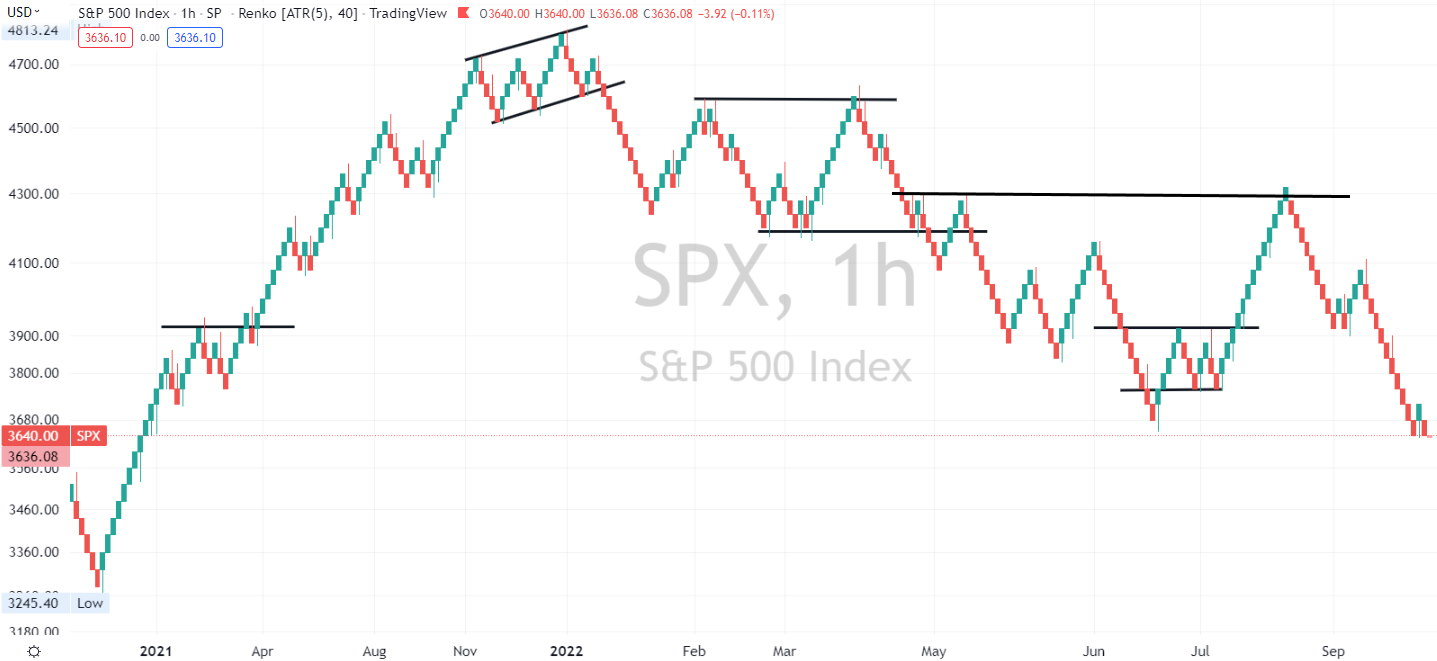
2. Support and Resistance Strategy:
Renko charts also lend themselves well to support and resistance analysis. Traders can pinpoint key support and resistance levels with greater accuracy due to the reduction of market noise.
To implement this strategy, traders can:
- Identify areas where the price repeatedly reverses its direction, resulting in the formation of multiple bricks at the same price level.
- Use these levels as support or resistance zones and make trading decisions based on price reactions near these zones.
- Combine Renko chart analysis with traditional support and resistance tools, such as horizontal lines and trendlines, to validate key levels.
3. Breakout Strategy:
The breakout strategy involves capitalizing on significant price movements beyond established support and resistance levels. Renko charts can help traders identify breakout opportunities with improved clarity.
To use this strategy, traders can:
- Identify consolidation patterns on the Renko chart, where price movements are confined within a narrow range of bricks.
- Wait for a breakout to occur, where the price moves beyond the established range, resulting in the creation of new bricks.
- Enter trades in the direction of the breakout, placing stop-loss orders near the breakout level to manage risk.
Techniques for Interpreting Renko Chart Patterns
1. Brick Size Selection:
The choice of brick size plays a crucial role in Renko chart interpretation. Smaller brick sizes provide more granular detail but can also lead to an excessive number of false signals. On the other hand, larger brick sizes may oversimplify the chart and obscure crucial price movements. Traders should consider their trading style, risk tolerance, and market volatility when selecting a brick size.
2. Combining Renko Charts with Other Indicators:
While Renko charts offer valuable insights into price trends, combining them with other technical indicators can enhance trading decisions. Common indicators like moving averages, Relative Strength Index (RSI), and MACD can provide additional confirmation of trend strength and potential reversals.
3. Identifying Patterns:
Renko charts may reveal specific chart patterns, such as double tops, double bottoms, and triangles, more clearly than traditional charts. Traders should learn to recognize these patterns on Renko charts and apply corresponding trading strategies.
4. Monitoring Price Action:
Since Renko charts do not incorporate time intervals, monitoring price action becomes even more crucial. Traders should pay close attention to sudden spikes, gaps, and periods of high volatility that can impact price movement.
Footnote
Forex trading using Renko charts offers a unique perspective on price action, enabling traders to identify trends, support and resistance levels, and breakout opportunities with enhanced clarity. The simplicity of Renko charts, combined with their ability to filter out market noise, makes them a valuable tool in a trader's arsenal. By mastering the techniques for interpreting Renko chart patterns and integrating them with other technical analysis tools, traders can develop effective forex trading strategies that capitalize on the strengths of Renko charts while navigating the complexities of the forex market.


Discussion