
Forex trading strategies for using the Williams %R indicator: Approaches for trading with the Williams %R indicator.
The world of forex trading is a dynamic and fast-paced environment where traders employ a variety of tools and strategies to gain an edge and maximize their profits. One such tool that has gained popularity among traders is the Williams %R indicator. Developed by Larry Williams, this technical analysis tool offers insights into potential overbought or oversold conditions in the market, aiding traders in making informed decisions. In this article, we will delve into the Williams %R indicator, its mechanics, and explore different approaches to effectively incorporate it into forex trading strategies.
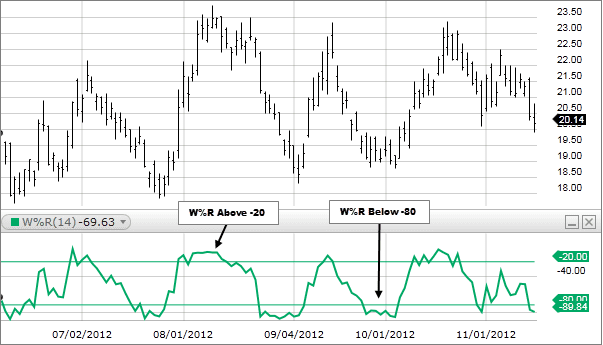
Table Content
I. Understanding the Williams %R Indicator
II. Approaches for Trading with the Williams %R Indicator
1. Overbought and Oversold Conditions: Reversal Strategy
2. Crossover Strategy
3. Divergence Strategy
a) Bullish Divergence
b) Bearish Divergence
4. Trend Confirmation Strategy
III. Implementing Williams %R Indicator Strategies: Considerations and Tips
1. Combine with Other Indicators
2. Avoid Overtrading
3. Practice Risk Management
4. Adapt to Market Conditions
5. Back-testing and Practice
6. Stay Informed
IV. Footnote
Understanding the Williams %R Indicator
The Williams %R indicator, often referred to simply as "%R," is a momentum oscillator that measures the level of the current price relative to the highest high and lowest low over a specific period, usually 14 periods. The indicator values range from -100 to 0, where values below -80 typically suggest that the market is oversold and due for a potential reversal, while values above -20 indicate an overbought market condition.
The formula for calculating the Williams %R indicator is as follows:
%R = (Highest High - Current Close) / (Highest High - Lowest Low) * -100
With this formula, the Williams %R indicator oscillates within the -100 to 0 range, offering traders insights into the potential strength and direction of price movements.
Approaches for Trading with the Williams %R Indicator
1. Overbought and Oversold Conditions: Reversal Strategy
One of the most common uses of the Williams %R indicator is to identify overbought and oversold conditions, which can provide valuable information about potential trend reversals. When the indicator's value crosses above -20, it signals an overbought market, indicating that a price correction or reversal might be imminent. Conversely, when the indicator's value crosses below -80, it suggests an oversold market, indicating a potential upward reversal.
Traders using this strategy may look for confirmation from other technical indicators or chart patterns before executing their trades. For instance, a bullish divergence (when the price makes lower lows while the indicator makes higher lows) could provide additional evidence of a potential reversal.
2. Crossover Strategy
Similar to other momentum indicators, the Williams %R indicator can also be used in crossover strategies. This involves looking for crossovers between the indicator and a moving average or another oscillating indicator, such as the Moving Average Convergence Divergence (MACD). A bullish crossover occurs when the %R indicator crosses above a specified level (e.g., -50), indicating a potential shift from a bearish to a bullish trend. Conversely, a bearish crossover occurs when the %R indicator crosses below the same level, suggesting a potential shift from a bullish to a bearish trend.
Crossover strategies can be effective when combined with proper risk management techniques, as false signals are possible during periods of low volatility.
3. Divergence Strategy
Divergence occurs when the direction of the price movement diverges from the direction of the Williams %R indicator. This can be a powerful tool for traders to anticipate potential reversals or trend continuations. There are two types of divergences: bullish and bearish.
a) Bullish Divergence: This occurs when the price makes lower lows while the %R indicator makes higher lows. This suggests that despite the price declining, the momentum is shifting to the upside, indicating a potential trend reversal.
b) Bearish Divergence: Conversely, bearish divergence occurs when the price makes higher highs while the %R indicator makes lower highs. In this case, even though the price is rising, the momentum is waning, indicating a potential downward reversal.
Divergence trading requires careful observation and confirmation from other indicators or patterns, as false signals can occur.
4. Trend Confirmation Strategy
In addition to identifying potential reversals, the Williams %R indicator can also be used to confirm the strength of an existing trend. During a strong uptrend, the indicator's values are more likely to stay in the upper range, while in a strong downtrend, the values tend to remain in the lower range. Traders can use these indications to validate the trend direction and make informed decisions about entering or exiting trades in alignment with the prevailing trend.
Implementing Williams %R Indicator Strategies: Considerations and Tips
While the Williams %R indicator offers valuable insights, it's important for traders to approach its use with careful consideration and follow best practices:
1. Combine with Other Indicators: The Williams %R indicator should ideally be used in conjunction with other technical indicators, such as moving averages, trendlines, or oscillators, to validate signals and minimize false alarms.
2. Avoid Overtrading: Like any technical indicator, the Williams %R can produce false signals, especially in choppy or ranging markets. Avoid overtrading and always confirm signals through additional analysis.
3. Practice Risk Management: Implement proper risk management techniques, such as setting stop-loss and take-profit levels, to protect your capital from potential losses.
4. Adapt to Market Conditions: Market conditions can change rapidly. Be prepared to adjust your strategy or temporarily pause trading when market volatility is high or news events are pending.
5. Back-testing and Practice: Before using the Williams %R indicator in live trading, backtest your strategies on historical data to assess their effectiveness. Additionally, consider using demo accounts to practice and refine your skills.
6. Stay Informed: Stay updated on economic events, news releases, and geopolitical developments that could impact the forex market. External factors can influence price movements and potentially invalidate indicator signals.
Footnote:
The Williams %R indicator is a versatile tool that can enhance a trader's decision-making process when used effectively. Whether you're a novice trader or an experienced professional, incorporating the various strategies mentioned in this article can help you navigate the complexities of the forex market with more confidence. Remember that while the Williams %R indicator provides valuable insights, it should not be used in isolation. By combining its signals with other indicators and thorough analysis, traders can develop a holistic approach to trading that improves their chances of success in this competitive arena.


Discussion