

Forex trading strategies for using the Symmetrical Triangle pattern: Techniques for trading with the Symmetrical Triangle chart pattern.
In the world of forex trading, mastering technical analysis is crucial for identifying profitable trading opportunities. One of the most versatile and reliable chart patterns is the Symmetrical Triangle pattern. This pattern provides valuable insights into potential price movements and offers traders a range of strategies to capitalize on these opportunities. In this article, we will delve into the techniques for effectively trading with the Symmetrical Triangle chart pattern.
Table Content
I. Understanding the Symmetrical Triangle Pattern
II. Trading Strategies for the Symmetrical Triangle Pattern
1. Identifying Entry Points
2. Confirming Breakouts
3. Setting Stop-Loss and Take-Profit Levels
4. Utilizing Retests
5. Considering Timeframes
III. Footnote
Understanding the Symmetrical Triangle Pattern
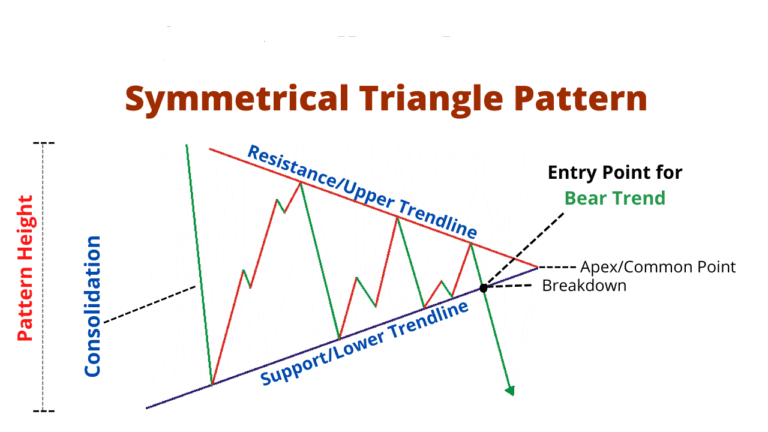
The Symmetrical Triangle pattern is a continuation pattern that occurs during trends, either bullish or bearish. It is formed by drawing two converging trendlines that connect a series of higher lows and lower highs. This creates a triangular formation that narrows as time progresses, indicating a potential price breakout in the near future.
Traders often refer to the Symmetrical Triangle as a coiling pattern because it symbolizes a temporary balance between buyers and sellers. As the pattern develops, the price range contracts, indicating decreasing volatility and a potential buildup of momentum. This compression of price action sets the stage for a significant price movement.
Trading Strategies for the Symmetrical Triangle Pattern
1. Identifying Entry Points:
The first step in trading with the Symmetrical Triangle pattern is identifying potential entry points. Traders should closely monitor the price as it approaches the apex of the triangle, where the two trendlines converge. The apex represents a point of indecision in the market, often followed by a breakout.
The breakout can occur in either direction – upwards or downwards – and this will determine whether to take a long or short position. Some traders prefer to wait for a confirmed breakout before entering a trade, while others opt for a more aggressive approach by entering a position as the price approaches the apex.
2. Confirming Breakouts:
Breakouts from the Symmetrical Triangle pattern are usually accompanied by an increase in trading volume. Volume is a critical confirmation tool because it indicates the strength and validity of the breakout. A breakout with higher-than-average volume is generally more reliable than one with low volume.
Traders should wait for the candlestick to close above or below the upper or lower trendline before considering the breakout confirmed. False breakouts can occur, where the price temporarily moves beyond a trendline but then retreats back into the pattern. By waiting for a candlestick close, traders can reduce the risk of falling for false signals.
3. Setting Stop-Loss and Take-Profit Levels:
Managing risk is a fundamental aspect of successful trading. When trading with the Symmetrical Triangle pattern, setting appropriate stop-loss and take-profit levels is essential. Stop-loss orders are typically placed just outside the pattern, on the opposite side of the breakout. This helps limit potential losses in case the breakout fails and the price reverses.
Take-profit levels can be set based on the height of the triangle pattern. Measure the distance between the highest and lowest points of the triangle and apply that measurement to the breakout point. This provides an estimate of the potential price movement after the breakout. However, it's important to adapt this strategy to the prevailing market conditions and use other indicators or analysis to refine your take-profit levels.
4. Utilizing Retests:
After a breakout, it's common for the price to retest the trendline that was broken. This retest acts as a confirmation of the breakout and can provide traders with an additional entry opportunity. If the price breaks out to the upside, the previously resistance trendline can act as support during the retest, and vice versa.
Traders can look for bullish or bearish candlestick patterns during the retest to validate their entry. For example, a bullish engulfing pattern near a support trendline can signal a potential long entry, while a bearish engulfing pattern near a resistance trendline might suggest a short opportunity.
5. Considering Timeframes:
Different timeframes can offer varying perspectives on the Symmetrical Triangle pattern. Traders should analyze the pattern on multiple timeframes to gain a comprehensive understanding of the potential price movement. For instance, a breakout on the daily chart might align with a significant trendline or moving average on the weekly chart, further strengthening the trade's viability.
Shorter timeframes, such as the 1-hour or 15-minute charts, can help fine-tune entries and exits. These timeframes provide more detailed information about the price action within the pattern, aiding in decision-making.
Footnote
The Symmetrical Triangle pattern is a versatile tool in a forex trader's arsenal, offering insights into potential price movements and opportunities for profit. By mastering the art of identifying and trading this pattern, traders can navigate the dynamic forex market with greater confidence. Remember that no trading strategy is foolproof, and risk management is crucial. It's advisable to practice these techniques on a demo account before implementing them in live trading and to combine the Symmetrical Triangle analysis with other technical and fundamental tools for a well-rounded trading approach.


Discussion