Forex Trading Strategies for Using the Stochastic Oscillator: Approaches for Trading with the Stochastic Oscillator
The foreign exchange (forex) market is a dynamic and highly liquid arena where traders strive to capitalize on currency price movements. To navigate this ever-changing landscape, traders employ a variety of tools and strategies, one of which is the Stochastic Oscillator. This widely used technical indicator is renowned for its ability to identify potential entry and exit points in the market. In this article, we'll delve into the concept of the Stochastic Oscillator, explore its components, and discuss several effective trading strategies that utilize this tool.
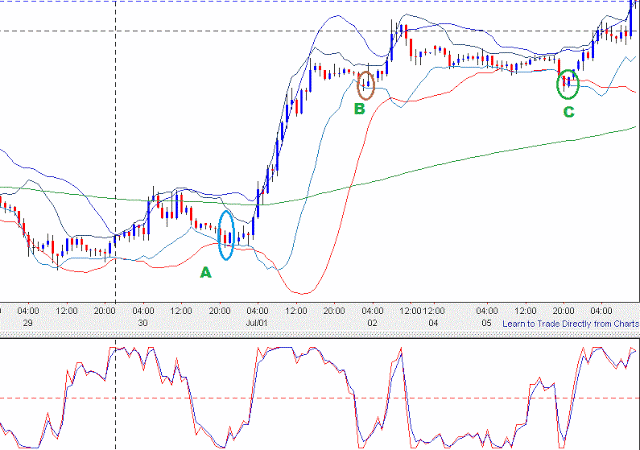
Table Content
I. Understanding the Stochastic Oscillator
II. Stochastic Oscillator Trading Strategies
1. The Classic Overbought and Oversold Strategy
2. The Stochastic Divergence Strategy
3. The Stochastic Crossover Strategy
4. The Stochastic Trend Following Strategy
5. The Stochastic Double Cross Strategy
III. Risk Management and Limitations:
IV. Footnote
I. Understanding the Stochastic Oscillator:
Developed by George C. Lane in the 1950s, the Stochastic Oscillator is a momentum-based indicator that compares the closing price of a currency pair to its price range over a certain period. The indicator comprises two lines: the %K line, also known as the fast line, and the %D line, the slow line. The %K line represents the current market momentum, while the %D line is a moving average of the %K line. The Stochastic Oscillator operates on a scale of 0 to 100, with readings above 80 indicating an overbought condition and readings below 20 indicating an oversold condition.
II. Stochastic Oscillator Trading Strategies:
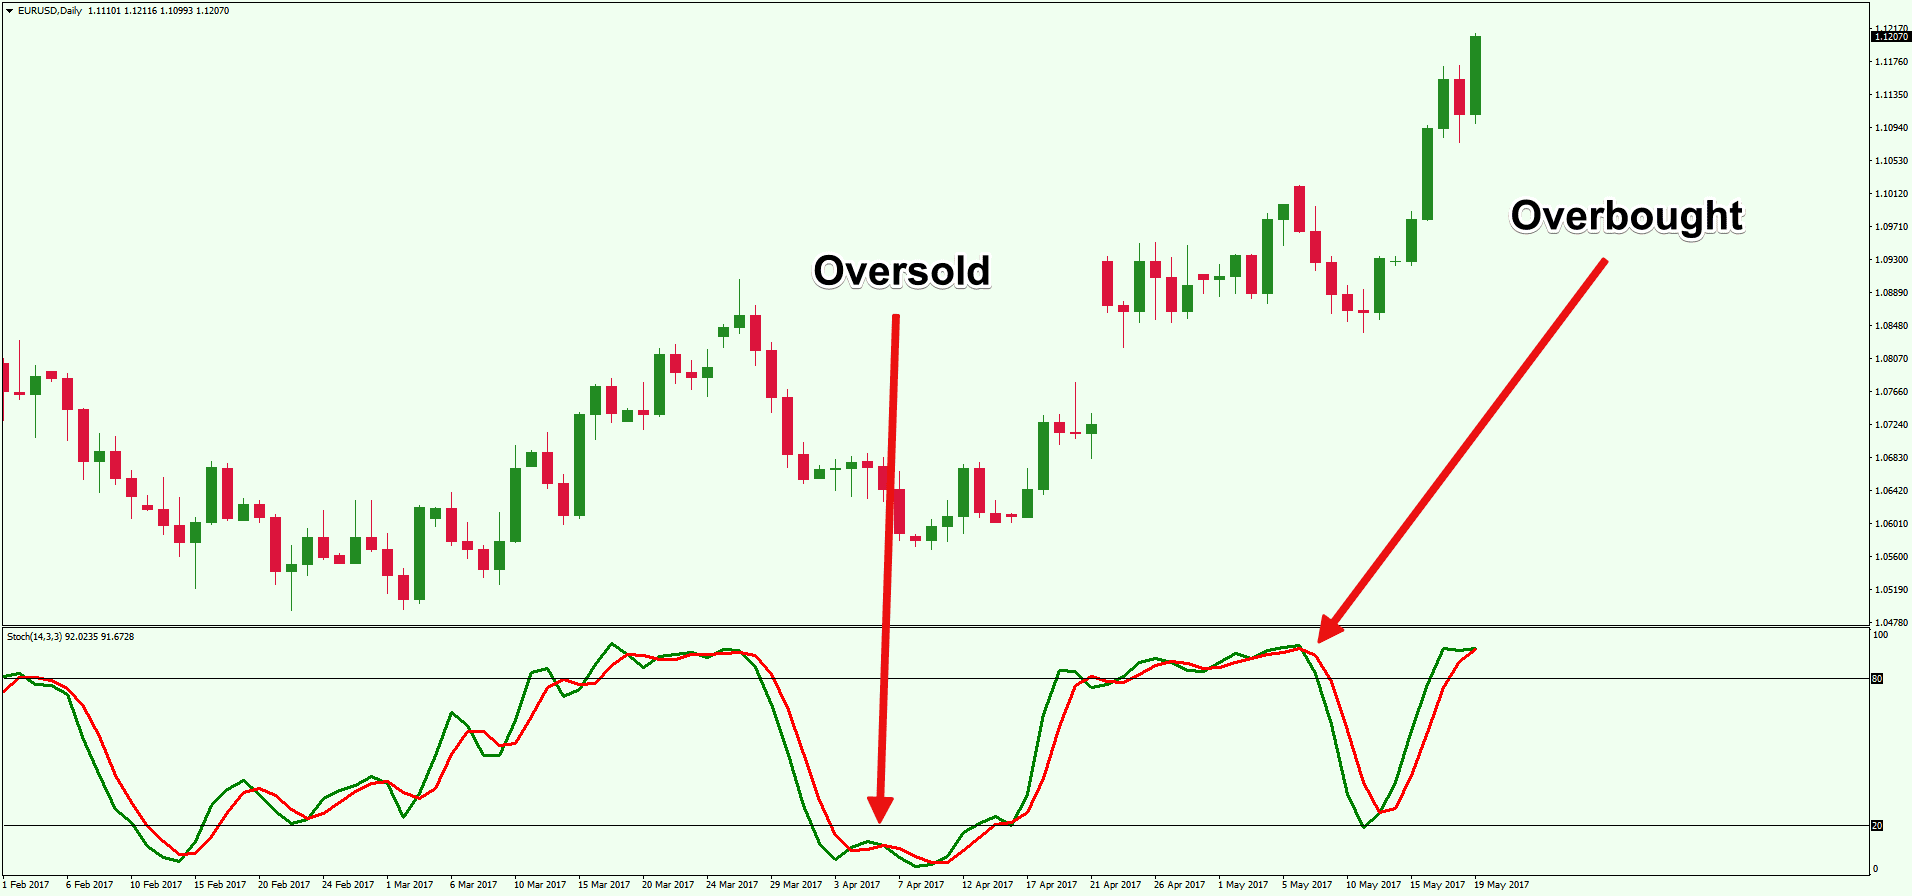
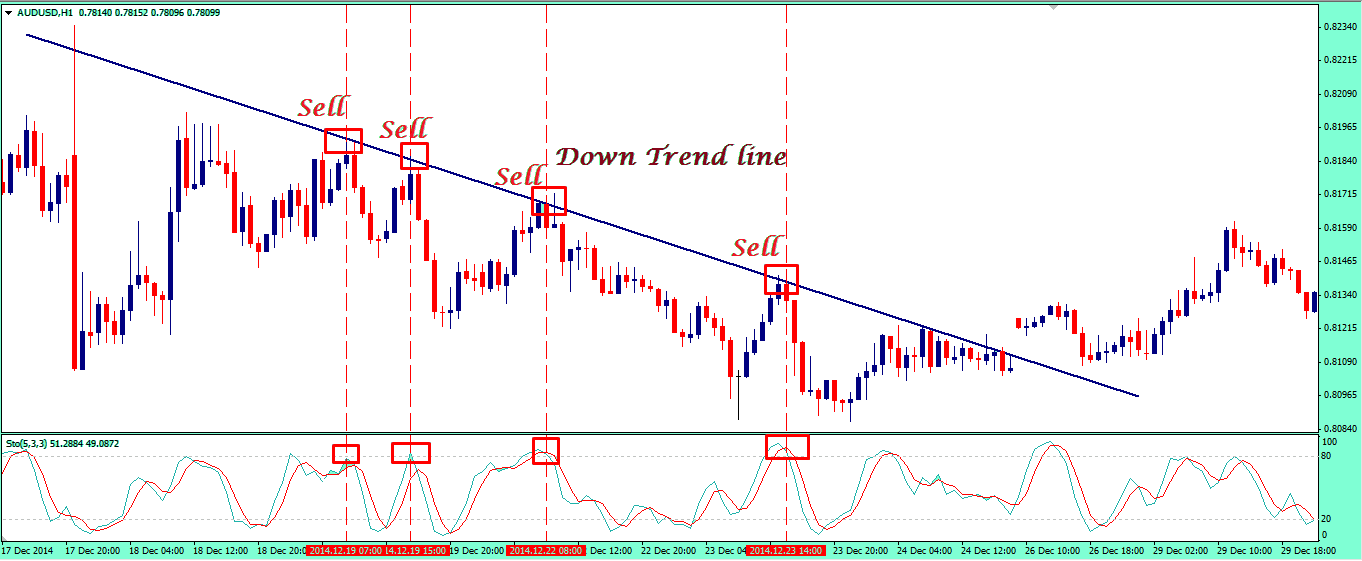
1. The Classic Overbought and Oversold Strategy: This strategy involves identifying overbought and oversold conditions using the Stochastic Oscillator. When the %K line crosses below the %D line and falls below the oversold threshold (usually around 20), it suggests a potential upward reversal. Conversely, when the %K line crosses above the %D line and rises above the overbought threshold (typically around 80), it implies a potential downward reversal. Traders can enter buy positions when the oversold condition triggers and sell positions when the overbought condition activates.
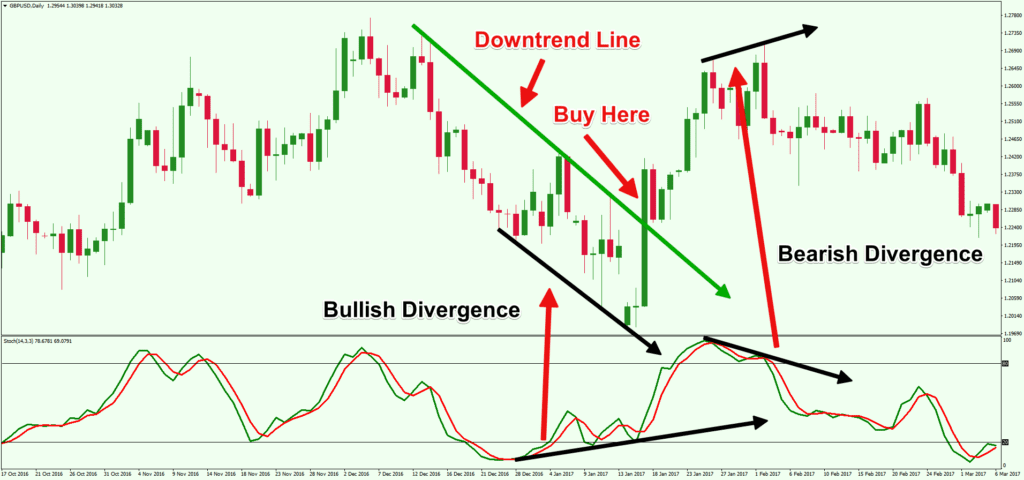
2. The Stochastic Divergence Strategy: Divergence occurs when the Stochastic Oscillator's readings differ from the price movement of the currency pair. Positive divergence occurs when the price forms lower lows, but the Stochastic Oscillator forms higher lows. Conversely, negative divergence happens when the price forms higher highs, but the Stochastic Oscillator forms lower highs. Divergence can indicate potential trend reversals. For instance, positive divergence could signal an upcoming bullish reversal, while negative divergence might indicate an impending bearish reversal.
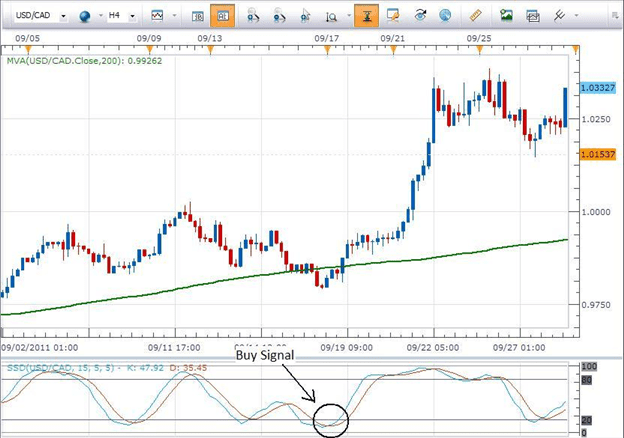
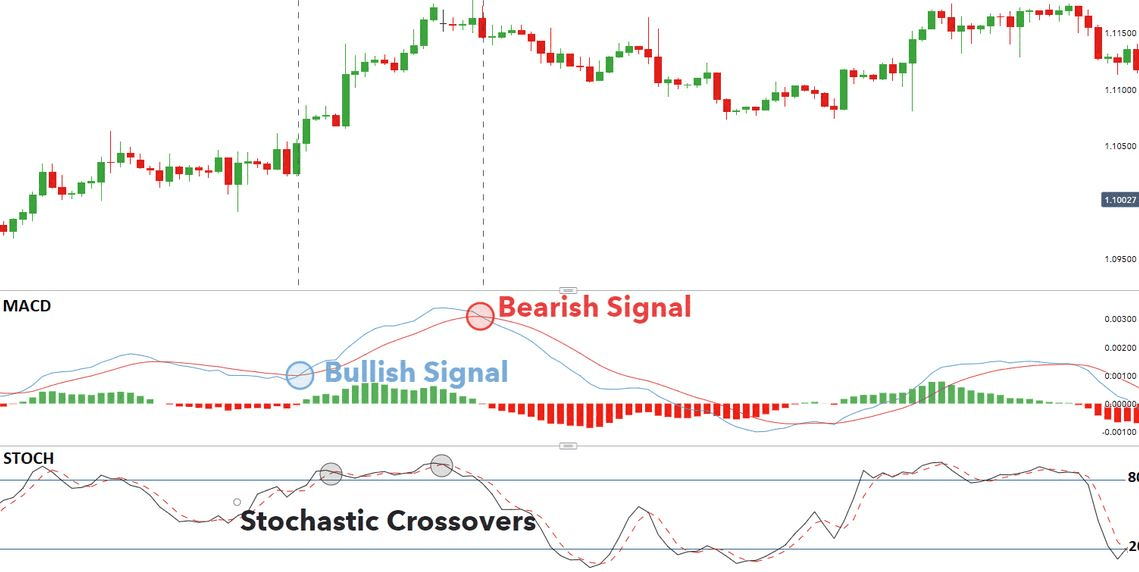
3. The Stochastic Crossover Strategy: This strategy involves the interaction of the %K and %D lines. When the %K line crosses above the %D line, it generates a bullish crossover signal, suggesting a potential upward price movement. Conversely, when the %K line crosses below the %D line, it generates a bearish crossover signal, implying a potential downward price movement. Traders often wait for these crossovers to confirm their entry and exit decisions.
4. The Stochastic Trend Following Strategy: In this strategy, traders use the Stochastic Oscillator in conjunction with other indicators or trend analysis to identify the prevailing market trend. During a strong uptrend, the Stochastic Oscillator readings are more likely to remain in the overbought zone, and during a strong downtrend, the readings are more likely to stay in the oversold zone. Traders can use these zones as potential entry points, aligning their trades with the overall trend direction.
5. The Stochastic Double Cross Strategy: Combining the Stochastic Oscillator with two different timeframes can lead to the double cross strategy. A trader looks for crossovers on both a shorter and a longer timeframe Stochastic Oscillator. For instance, if the %K line crosses above the %D line on both the hourly and daily charts, it can signal a stronger potential upward movement. This strategy aims to capture trends with a higher degree of confirmation from multiple timeframes.
III. Risk Management and Limitations:
While the Stochastic Oscillator can be a valuable tool in a trader's arsenal, it's important to
acknowledge its limitations and practice proper risk management. One limitation is that the indicator can generate false signals, especially in ranging markets. Additionally, the Stochastic Oscillator might remain in overbought or oversold conditions for extended periods during strong trends, which could result in missed trading opportunities.
To mitigate these risks, traders should consider using the Stochastic Oscillator in combination with other technical indicators or chart patterns. Moreover, setting stop-loss orders to limit potential losses and adhering to a well-defined trading plan can help manage risk effectively.
IV. Footnote:
The Stochastic Oscillator is a versatile tool that offers traders insights into potential market reversals and trend movements. By mastering the various strategies outlined in this article, traders can enhance their decision-making processes and potentially improve their trading outcomes. However, like any trading strategy, the Stochastic Oscillator should be used in conjunction with other indicators and tools, and traders should always exercise disciplined risk management. With a thorough understanding of the Stochastic Oscillator and its applications, traders can navigate the forex market with increased confidence and precision.


Discussion