
Forex trading strategies for using the RSI Divergence: Techniques for trading with RSI divergence signals
The world of forex trading is characterized by its dynamic nature and constant evolution. As traders strive to stay ahead in this fast-paced market, the importance of employing effective strategies cannot be overstated. Among the plethora of tools and indicators available, the Relative Strength Index (RSI) stands out as a popular choice for traders seeking to identify potential price reversals and trends. When used in conjunction with divergence signals, RSI becomes a powerful tool that can significantly enhance a trader's decision-making process.
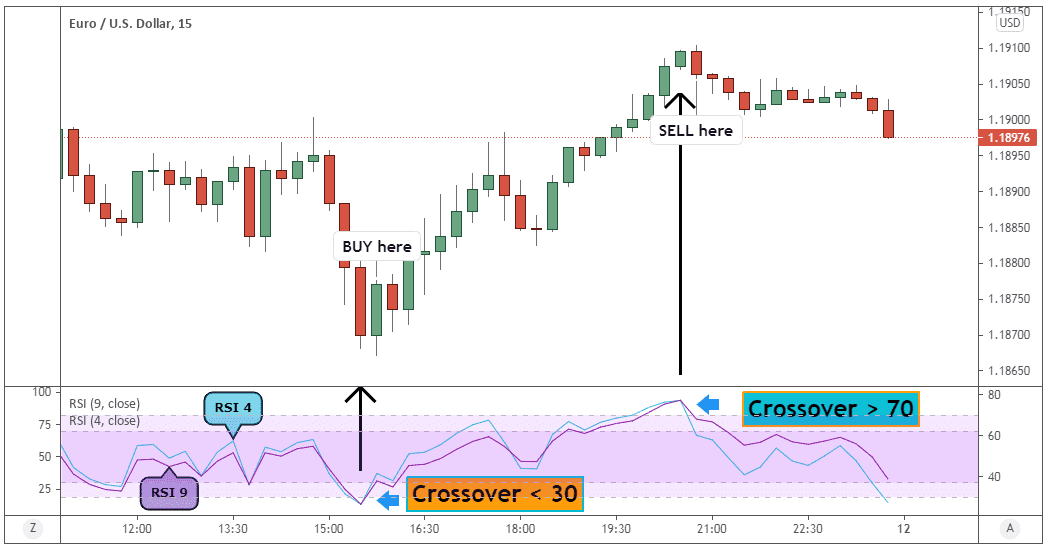
Table Content
I. Understanding the RSI Indicator and Divergence Signals
1. Regular Bullish Divergence
2. Regular Bearish Divergence
Strategy 1: Regular Divergence Confirmation
Strategy 2: Hidden Divergence for Trend Continuation
Strategy 3: RSI Overbought/Oversold with Divergence
Strategy 4: Multiple Timeframe Analysis
Strategy 5: RSI Divergence with Support/Resistance
Strategy 6: Practice Effective Risk Management
II. Footnote
Understanding the RSI Indicator and Divergence Signals
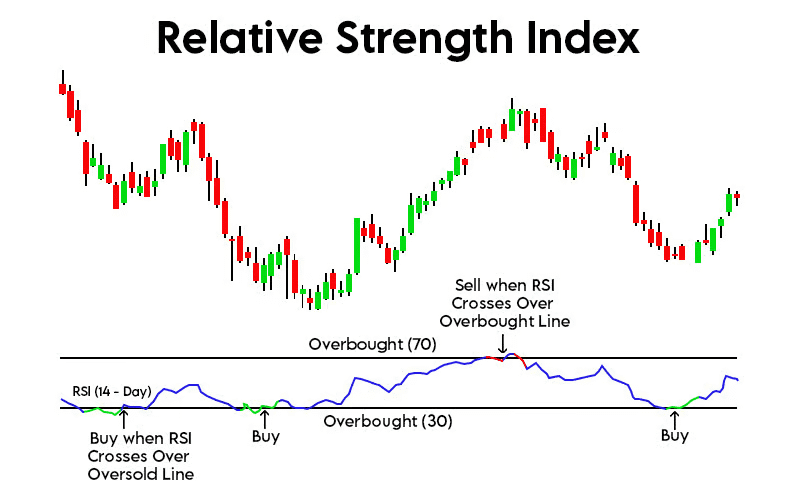
Before delving into specific trading strategies, it's essential to understand the core components of the RSI indicator and how divergence signals work. The RSI is a momentum oscillator that measures the speed and change of price movements. It oscillates between 0 and 100, with readings above 70 indicating overbought conditions and readings below 30 indicating oversold conditions.
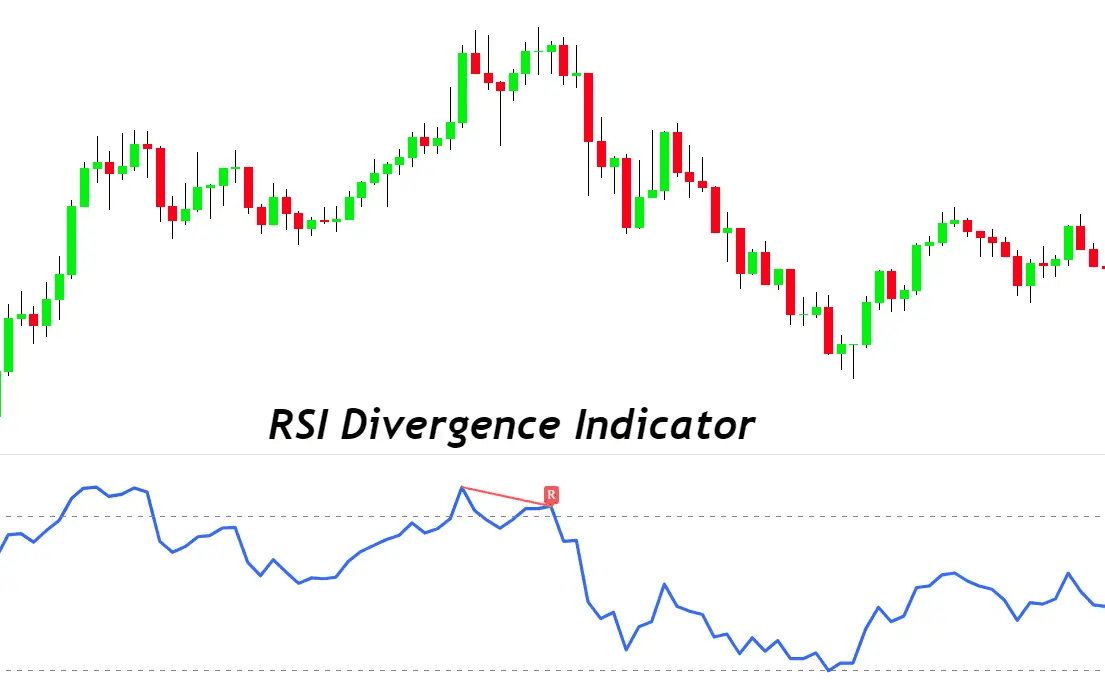
Divergence occurs when the price of an asset and an indicator move in opposite directions. RSI divergence specifically involves a discrepancy between the price's movement and the RSI's movement. There are two main types of RSI divergence:
1. Regular Bullish Divergence: This occurs when the price forms a lower low, but the RSI forms a higher low. It suggests that the momentum behind the price decline is waning, and a potential bullish reversal might be on the horizon.
2. Regular Bearish Divergence: In contrast, this type of divergence takes place when the price makes a higher high, but the RSI forms a lower high. It indicates that the upward momentum is weakening, potentially leading to a bearish reversal.
Mastering the art of trading with RSI divergence signals requires a blend of technical analysis skills, market intuition, and disciplined execution. Here are some proven strategies to effectively utilize RSI divergence signals in your forex trading journey:
Strategy 1: Regular Divergence Confirmation
One of the fundamental ways to incorporate RSI divergence signals is by using them as a confirmation tool. This strategy involves combining RSI divergence signals with other technical indicators, such as trendlines, moving averages, or candlestick patterns. By waiting for multiple indicators to align, traders can enhance the reliability of their trade entries.
For example, if you spot a regular bullish divergence on the RSI and simultaneously observe a trendline breakout on the price chart, the confluence of these signals strengthens the likelihood of a bullish reversal. This approach mitigates the risk of false signals and increases the probability of profitable trades.
Strategy 2: Hidden Divergence for Trend Continuation
In addition to regular divergence, traders can also harness the power of hidden divergence to identify opportunities for trend continuation. Hidden divergence occurs when the price forms a higher high or lower low, while the RSI forms a lower high or higher low. This type of divergence suggests that the underlying trend is still strong and likely to persist.
For instance, if an uptrend is accompanied by hidden bullish divergence (higher low on price, lower low on RSI), it signifies that even though the price is consolidating, the bullish momentum remains intact. This can be a valuable entry point to join the prevailing trend.
Strategy 3: RSI Overbought/Oversold with Divergence
Combining RSI divergence signals with overbought and oversold conditions can yield compelling trading opportunities. After identifying a divergence signal, wait for the RSI to enter the overbought (above 70) or oversold (below 30) region. This indicates an extreme price movement that could result in a reversal.
Suppose you spot a regular bearish divergence, suggesting an upcoming price decline. If the RSI also enters the overbought territory, it adds weight to the potential reversal scenario. This strategy aligns the momentum divergence with a critical level on the RSI, increasing the likelihood of a successful trade.
Strategy 4: Multiple Timeframe Analysis
Successful traders understand the significance of analyzing multiple timeframes. Applying this principle to trading with RSI divergence involves examining the same divergence signal on different timeframes. When divergence signals align across various timeframes, it strengthens the overall conviction in the trade setup.
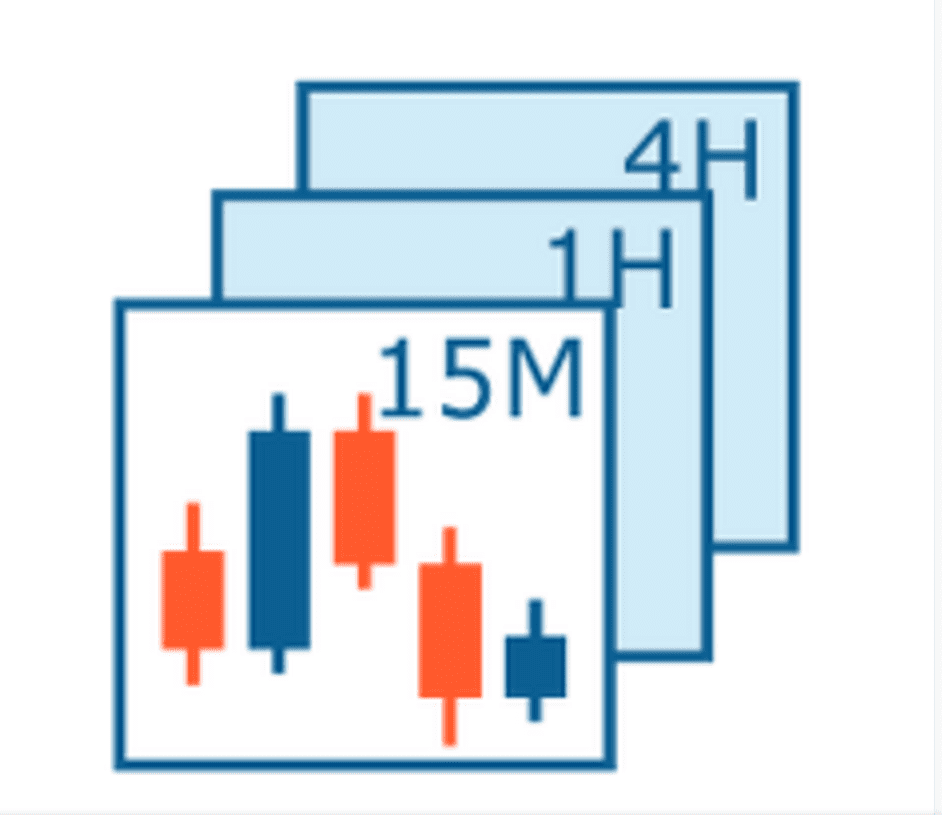
For example, if you identify hidden bullish divergence on the daily chart, check the RSI divergence signals on the 4-hour and 1-hour charts as well. If all timeframes show similar divergence patterns, it enhances the confidence in the trade and provides a more comprehensive view of the market dynamics.
Strategy 5: RSI Divergence with Support/Resistance
Integrating RSI divergence signals with key support and resistance levels can yield high-probability trade setups. When a divergence signal coincides with a significant support or resistance level, it adds a layer of confluence to the trade.
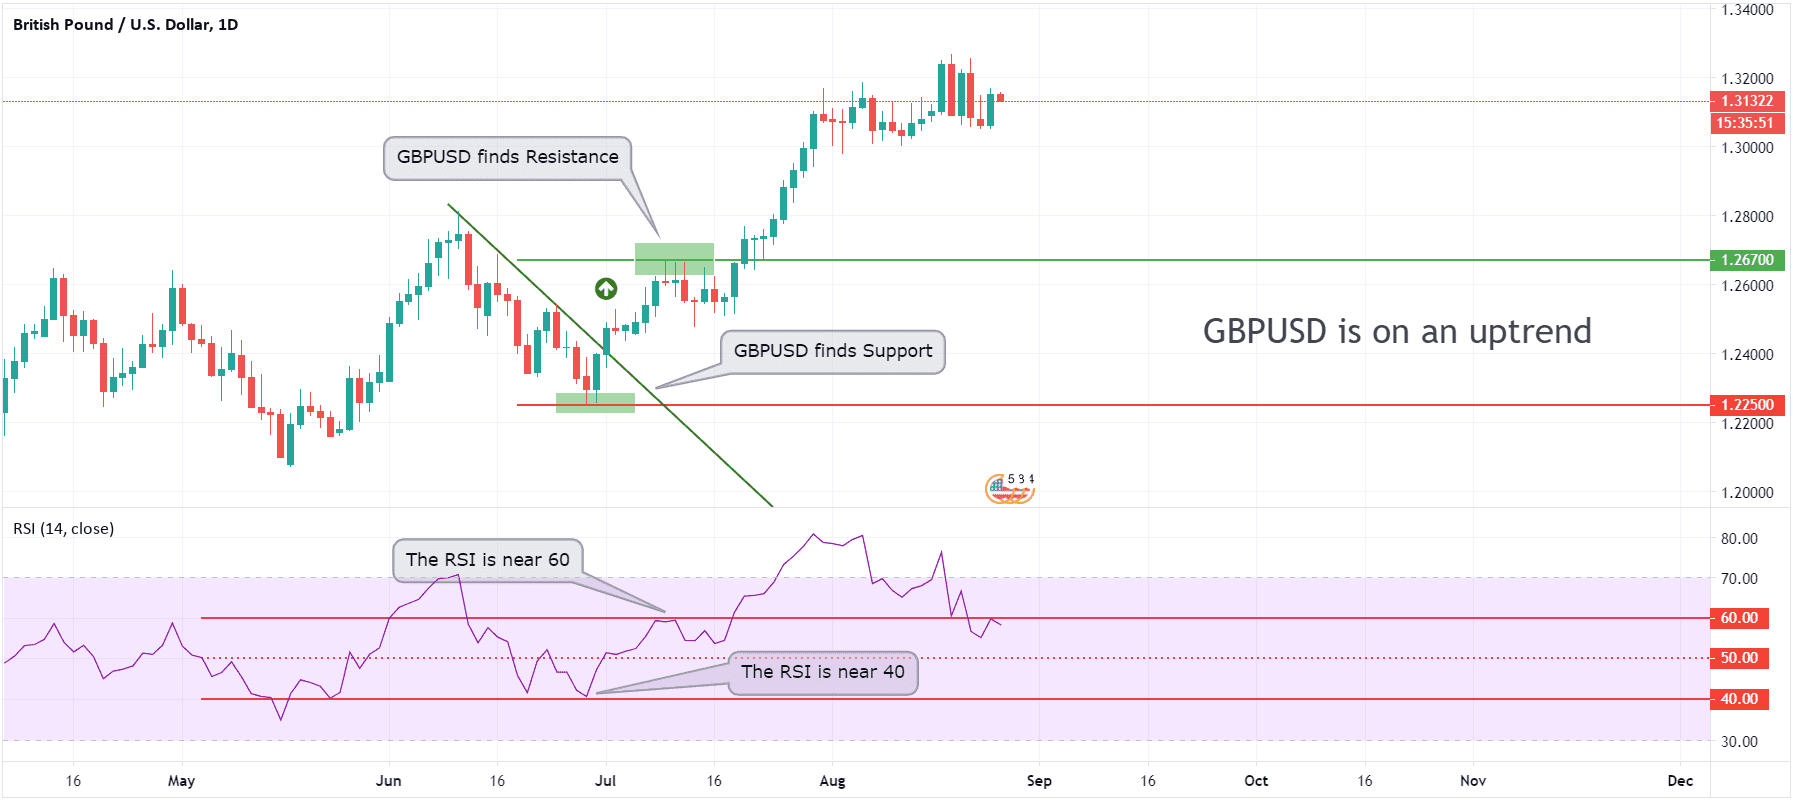
Suppose you identify regular bullish divergence near a strong support level. This suggests that not only is the momentum shifting, but the price is also at a level where buyers historically stepped in. This combination of factors can lead to potent reversal trades with well-defined risk and reward levels.
Strategy 6: Practice Effective Risk Management
No trading strategy is complete without a robust risk management plan. While RSI divergence signals can provide valuable insights, they are not foolproof and can still result in losses. Traders should always use appropriate position sizing, set stop-loss orders, and avoid risking more than a certain percentage of their trading capital on a single trade.
Footnote
Trading forex using RSI divergence signals offers a comprehensive approach to capturing potential price reversals and trend continuations. By mastering the various strategies discussed above and coupling them with disciplined risk management, traders can significantly enhance their chances of success in the dynamic and ever-evolving forex market. Remember that like any trading strategy, practice, continuous learning, and adaptability are crucial for long-term success.


Discussion