

Forex Trading Strategies for Using the Rectangle Pattern: Techniques for Trading with the Rectangle Chart Pattern
In the dynamic world of forex trading, traders continuously seek patterns and signals that can provide insights into potential market movements. The rectangle pattern, a common chart pattern, is one such tool that traders can use to identify potential trading opportunities. This article explores the rectangle pattern, its characteristics, and various forex trading strategies that can be employed to make informed trading decisions using this pattern.
Table Content
I. Understanding the Rectangle Pattern
1. Support and Resistance Levels
2. Price Movement
II. Identifying the Rectangle Pattern
1. Chart Analysis
2. Consistent Highs and Lows
3. Confirmation
III. Trading Strategies for Rectangle Patterns
1. Range Trading Strategy
2. Breakout Strategy
3. Volume Analysis Strategy
4. Measuring the Price Target
5. Wait for Confirmation
6. Combining with Other Indicators
IV. Risk Management and Limitations
1. False Breakouts
2. Market News and Events
3. Risk-to-Reward Ratio
4. Practice and Back-testing
V. Footnote
Understanding the Rectangle Pattern:
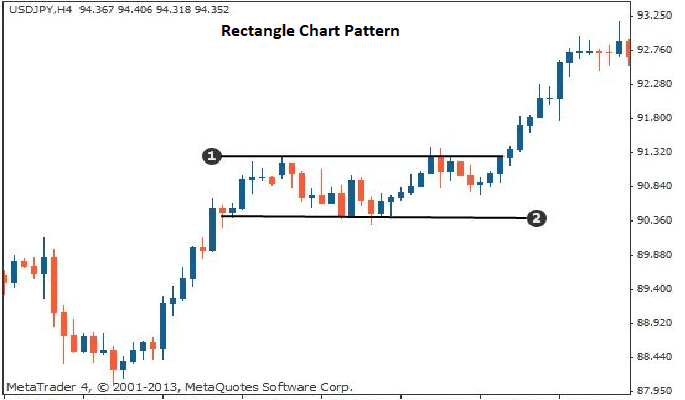
The rectangle pattern, also known as a trading range or consolidation pattern, is a technical analysis tool that occurs when the price of a currency pair moves within parallel support and resistance levels. This creates a rectangular shape on the price chart, hence the name. The pattern represents a period of market indecision, where neither bulls nor bears have a clear advantage. As a result, the price moves horizontally within a defined range.
The rectangle pattern typically consists of two main components:
1. Support and Resistance Levels: These are the horizontal lines that define the upper and lower boundaries of the rectangle. The support level prevents the price from falling further, while the resistance level prevents the price from rising higher.
2. Price Movement: Within the support and resistance boundaries, the price fluctuates as buyers and sellers test the strength of the levels. This results in a series of highs and lows that are relatively consistent, creating the rectangular shape.
Identifying the Rectangle Pattern:
Recognizing the rectangle pattern is crucial for successfully implementing trading strategies. Traders can follow these steps to identify the pattern:
1. Chart Analysis: Use candlestick or bar charts to visualize the price movement accurately. Zoom out to identify the presence of parallel support and resistance levels.
2. Consistent Highs and Lows: Look for a series of at least four highs and lows that are roughly at the same level, creating a horizontal range.
3. Confirmation: Confirm the pattern by observing multiple touches of the support and resistance levels without a clear breakout.
Once the rectangle pattern is identified, traders can consider various trading strategies to make informed decisions.
Trading Strategies for Rectangle Patterns:
1. Range Trading Strategy:
Range trading is well-suited for rectangle patterns due to the clearly defined support and resistance levels. Traders can buy near the support level and sell near the resistance level. As long as the price remains within the range, traders can repeatedly execute buy-low, sell-high trades. However, it's important to employ risk management techniques and avoid trading when the pattern is nearing its end, as a breakout is likely.
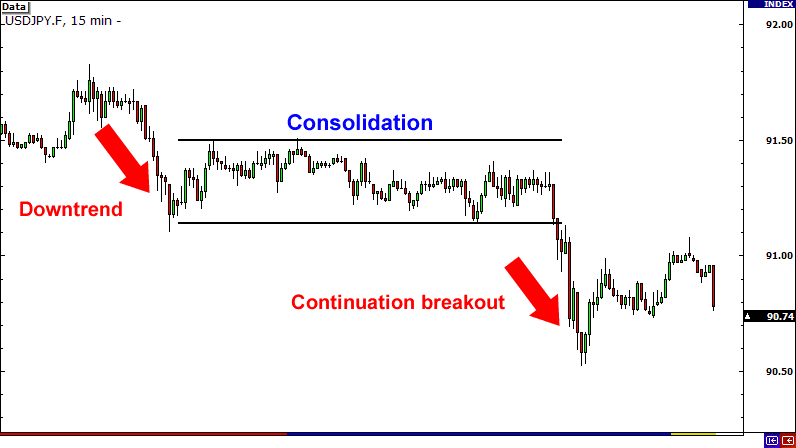
2. Breakout Strategy:
Rectangles don't last forever; they eventually lead to a breakout, where the price escapes the defined range. Traders can prepare for a breakout by placing pending orders just above the resistance level (for a bullish breakout) or below the support level (for a bearish breakout). This strategy anticipates a significant price movement following the breakout, potentially leading to substantial profits.
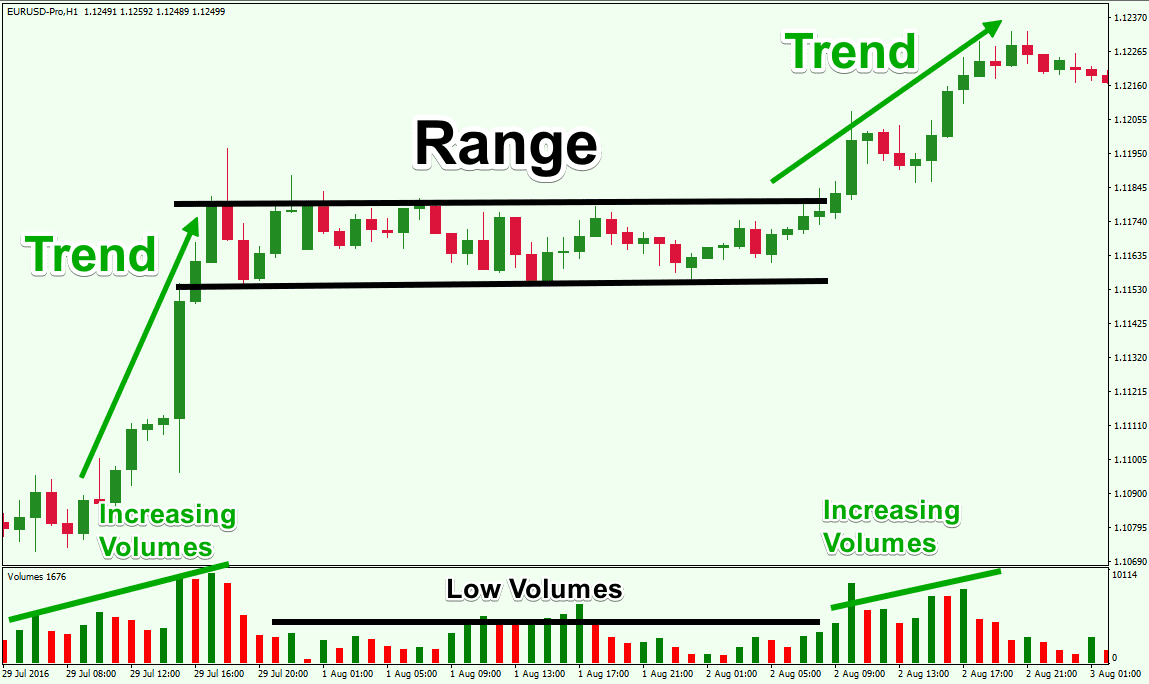
3. Volume Analysis Strategy:
Volume can provide valuable insights into the strength of a rectangle pattern. Traders can observe volume levels during the consolidation phase. A noticeable increase in volume during a breakout suggests stronger market conviction and increases the likelihood of a sustained trend. Conversely, a breakout accompanied by low volume may indicate a false breakout, prompting traders to exercise caution.
4. Measuring the Price Target:
After a breakout occurs, traders can estimate the potential price movement using the height of the rectangle pattern. Measure the vertical distance between the support and resistance levels and add it to the breakout point for a bullish breakout, or subtract it for a bearish breakout. This estimation can guide traders in setting profit targets.
5. Wait for Confirmation:
To avoid false breakouts, it's wise to wait for confirmation before entering a trade. After the price breaks out of the rectangle, wait for the retest of the breakout level. If the former resistance now acts as support (in the case of a bullish breakout), it increases the probability of a successful trade.
6. Combining with Other Indicators:
Traders can enhance the effectiveness of rectangle pattern strategies by combining them with other technical indicators. Moving averages, oscillators, and trendlines can provide additional confirmation of potential breakouts or reversals.
Risk Management and Limitations:
While the rectangle pattern offers valuable insights, it's important to acknowledge its limitations and implement risk management strategies:
1. False Breakouts: The rectangle pattern is not immune to false breakouts, where the price briefly moves beyond the support or resistance levels before reverting. Using confirmation techniques and volume analysis can help mitigate this risk.
2. Market News and Events: External factors, such as economic releases or geopolitical events, can override technical patterns. Always stay informed about upcoming news that might impact your trades.
3. Risk-to-Reward Ratio: Maintain a favorable risk-to-reward ratio for each trade. Avoid risking more than you stand to gain, even if the pattern appears promising.
4. Practice and Back-testing: Before implementing rectangle pattern strategies in a live trading environment, practice on a demo account and conduct thorough back-testing to understand how the strategy performs under different market conditions.
Footnote:
The rectangle pattern is a versatile tool in a forex trader's toolkit, offering insights into potential price movements during periods of consolidation. By understanding the pattern's characteristics and employing various trading strategies such as range trading, breakout strategies, and volume analysis, traders can make more informed trading decisions. However, as with any trading approach, risk management, continuous learning, and prudent decision-making are essential to achieve consistent success in forex trading.


Discussion