
Forex Trading Strategies for Using the Parabolic SAR: Approaches for Trading with the Parabolic SAR Indicator
The world of forex trading is both exciting and challenging, offering immense opportunities for those who can navigate the complexities of the market. One of the tools in a trader's arsenal is the Parabolic SAR (Stop and Reverse) indicator, which can provide valuable insights into potential trends and reversals in the market. In this article, we will delve into various forex trading strategies that leverage the Parabolic SAR indicator, helping traders make informed decisions and enhance their trading performance.
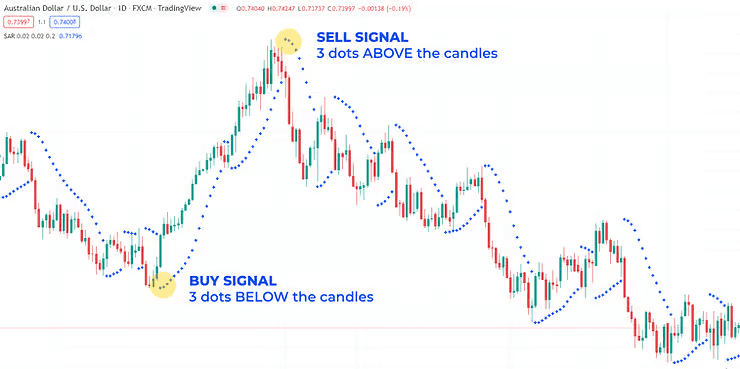
Table Content
I. Understanding the Parabolic SAR Indicator
1. The Basic SAR Strategy
2. Combining Parabolic SAR with Moving Averages
3. Parabolic SAR and RSI Strategy
4. Parabolic SAR for Trailing Stops
5. Volatility-Based Strategy
6. The SAR and ADX Combo
II. Footnote
Understanding the Parabolic SAR Indicator
Developed by J. Welles Wilder Jr., the Parabolic SAR is a versatile technical indicator used by traders to identify potential trend reversals. It visually appears as a series of dots either above or below the price chart, providing traders with signals that indicate when the trend direction might change. The Parabolic SAR indicator is particularly useful in volatile markets, where swift price movements can lead to rapid trend shifts.
The Parabolic SAR dots are placed above the price in a downtrend and below the price in an uptrend. As the price moves, the dots move as well, creating a trailing stop that follows the price movement. When the dots are above the price, it suggests a bearish trend, and when below, a bullish trend.
1. The Basic SAR Strategy
The simplest way to utilize the Parabolic SAR indicator is by considering its positioning in relation to the price. When the dots are below the price, it signals a potential uptrend, indicating a buying opportunity. Conversely, when the dots are above the price, it suggests a potential downtrend, signaling a selling opportunity. Traders can use this strategy as a foundation for their trading decisions. However, it's important to note that this approach might generate false signals in ranging markets.
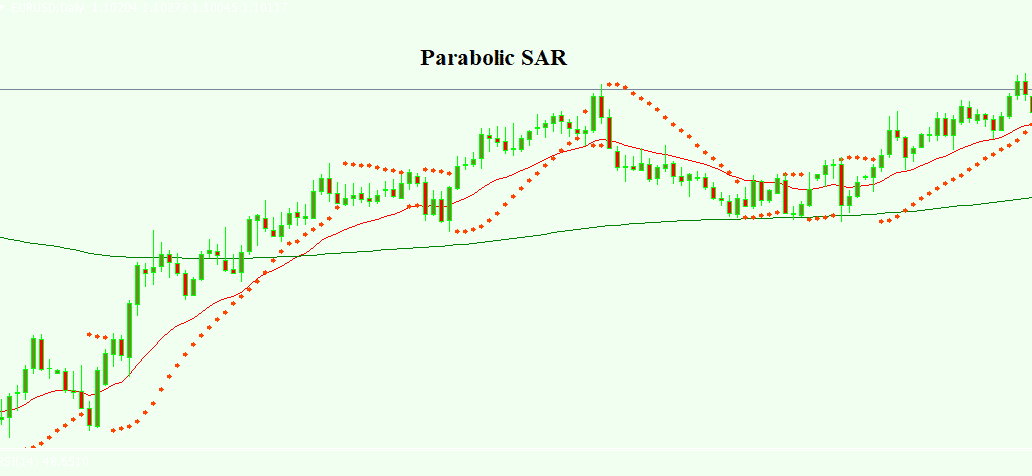
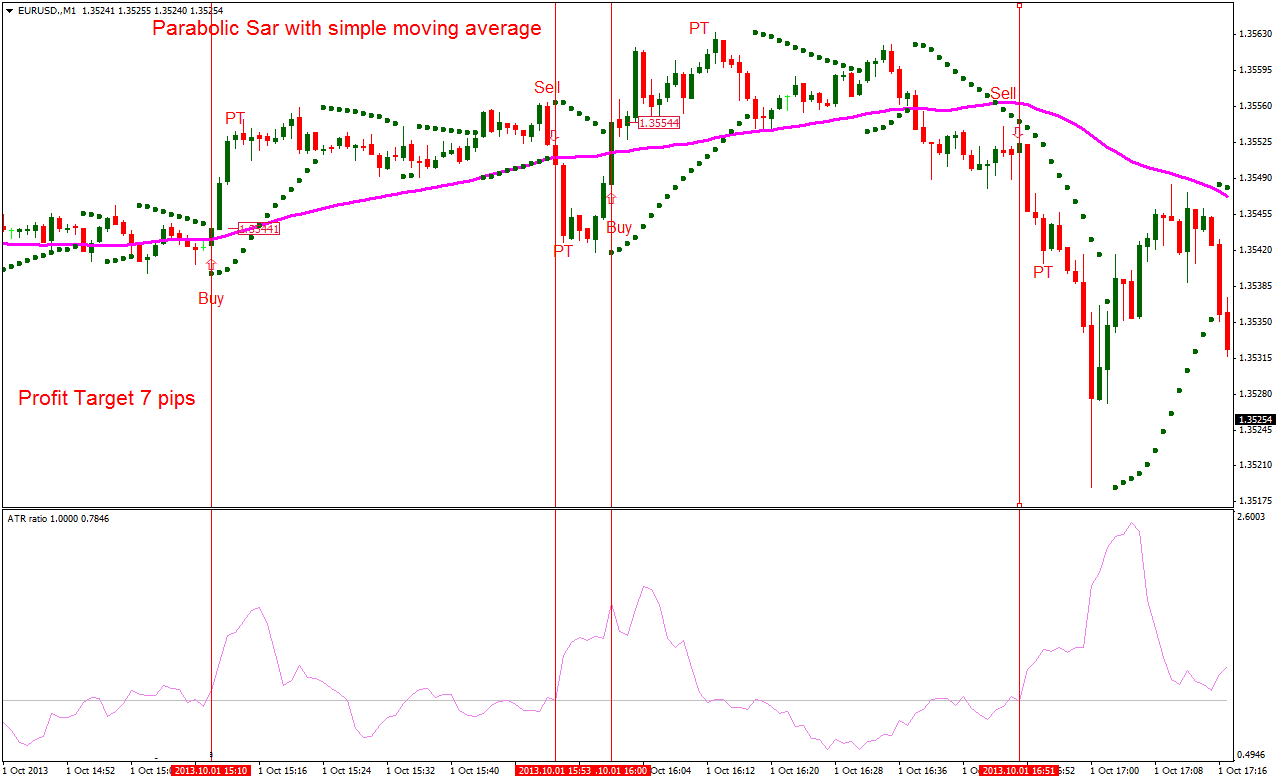
2. Combining Parabolic SAR with Moving Averages
To enhance the accuracy of the Parabolic SAR signals, traders often combine this indicator with moving averages. The Moving Average (MA) smoothens out price fluctuations, providing a clearer picture of the overall trend direction. When using this strategy, traders wait for the Parabolic SAR dots to align with the direction of the moving average. For instance, if the Parabolic SAR dots are below the price, indicating a bullish trend, and the price is also above a rising moving average, it provides stronger confirmation for a potential buy trade.
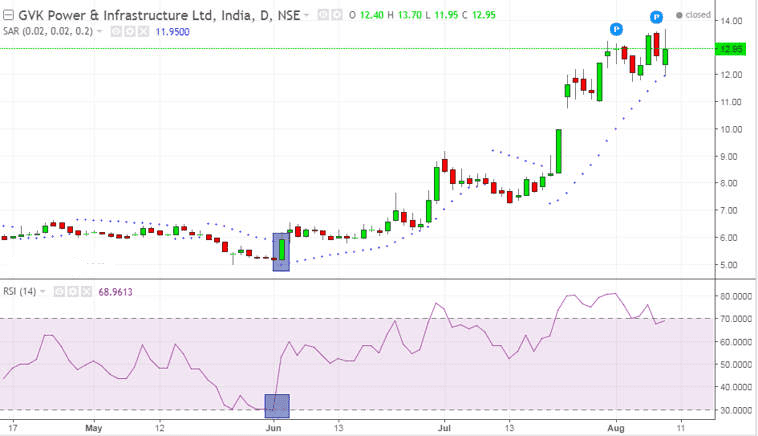
3. Parabolic SAR and RSI Strategy
The Relative Strength Index (RSI) is another popular technical indicator that measures the magnitude of recent price changes to evaluate overbought or oversold conditions. When combined with the Parabolic SAR, this strategy can provide a comprehensive approach to trading decisions. If the Parabolic SAR indicates a bullish trend and the RSI is in the oversold region (typically below 30), it suggests a potential buying opportunity with the assumption that the market might be due for a reversal.
4. Parabolic SAR for Trailing Stops
Apart from determining entry points, the Parabolic SAR can also serve as an effective tool for managing open trades. The trailing stop strategy involves adjusting the stop-loss level based on the movement of the Parabolic SAR dots. As the trend progresses, the dots move, trailing the price movement. Traders can adjust their stop-loss orders in line with the dots, allowing for potential gains to be locked in while still giving the trade room to breathe.
5. Volatility-Based Strategy
Volatility can greatly impact trading decisions, and the Parabolic SAR can be incorporated into a volatility-based strategy. In high volatility situations, the Parabolic SAR dots may be placed further from the price, while in low volatility conditions, the dots may tighten closer to the price. By considering both the positioning of the dots and their distance from the price, traders can adjust their trading approach to match the prevailing market conditions.
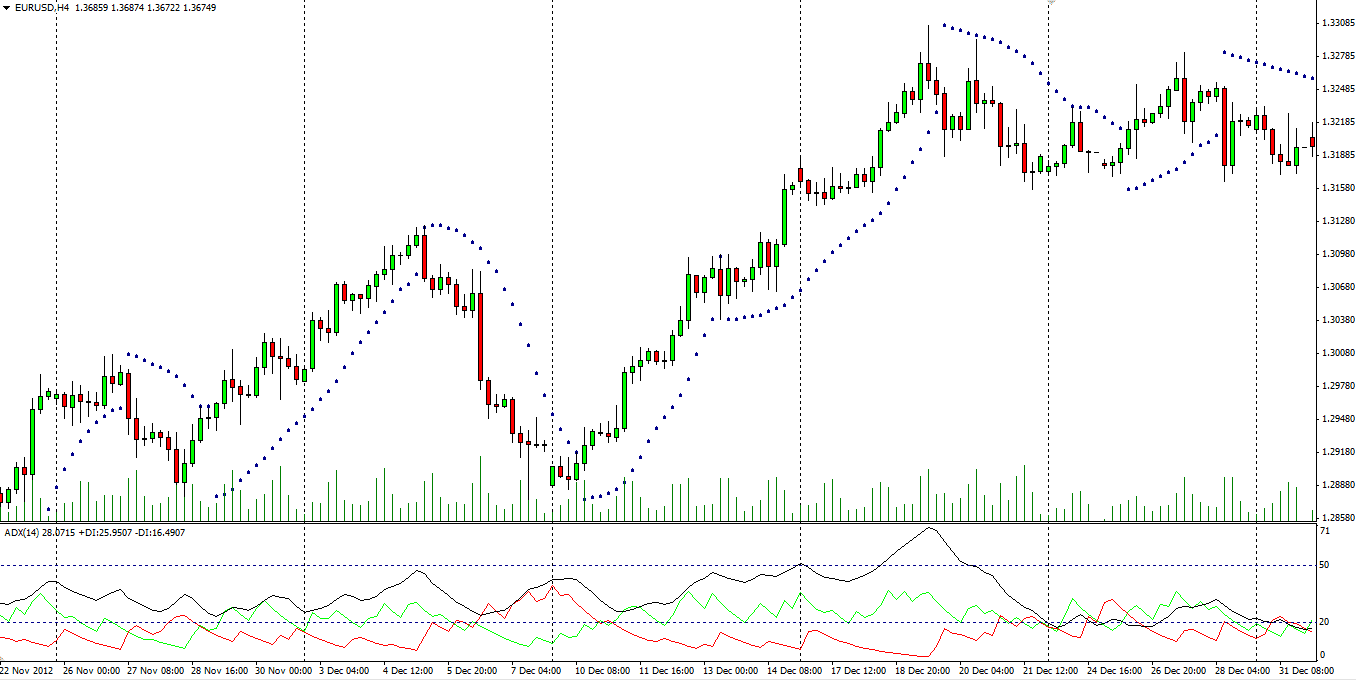
6. The SAR and ADX Combo
The Average Directional Index (ADX) is used to measure the strength of a trend, regardless of its direction. Combining ADX with the Parabolic SAR can provide a well-rounded view of both trend strength and potential reversal points. When the ADX indicates a strong trend and the Parabolic SAR generates a reversal signal, it could suggest a potent trading opportunity.
Footnote
The Parabolic SAR indicator is a powerful tool that can significantly enhance a trader's decision-making process. However, like any technical indicator, it's not foolproof and should be used in conjunction with other tools and analysis methods. The strategies outlined in this article provide a starting point for traders looking to leverage the Parabolic SAR indicator effectively.
Remember, successful trading requires a comprehensive understanding of market dynamics, risk management, and a well-defined trading plan. Traders should always practice in a demo environment before implementing strategies in live trading, as this can help them gain confidence and refine their approach. The forex market is dynamic and ever-changing, making continuous learning and adaptation essential for long-term success.


Discussion