
Forex trading strategies for using the Moving Average Ribbon: Approaches for trading with the Moving Average Ribbon indicator.
In the realm of forex trading, traders are constantly on the lookout for effective strategies that can help them navigate the complexities of the market and maximize their profits. One such strategy that has gained popularity among traders is the use of the Moving Average Ribbon indicator. This indicator offers insights into trends, momentum, and potential reversal points, making it a valuable tool in a trader's arsenal. In this article, we will delve into the concept of the Moving Average Ribbon and explore various approaches to forex trading using this indicator.
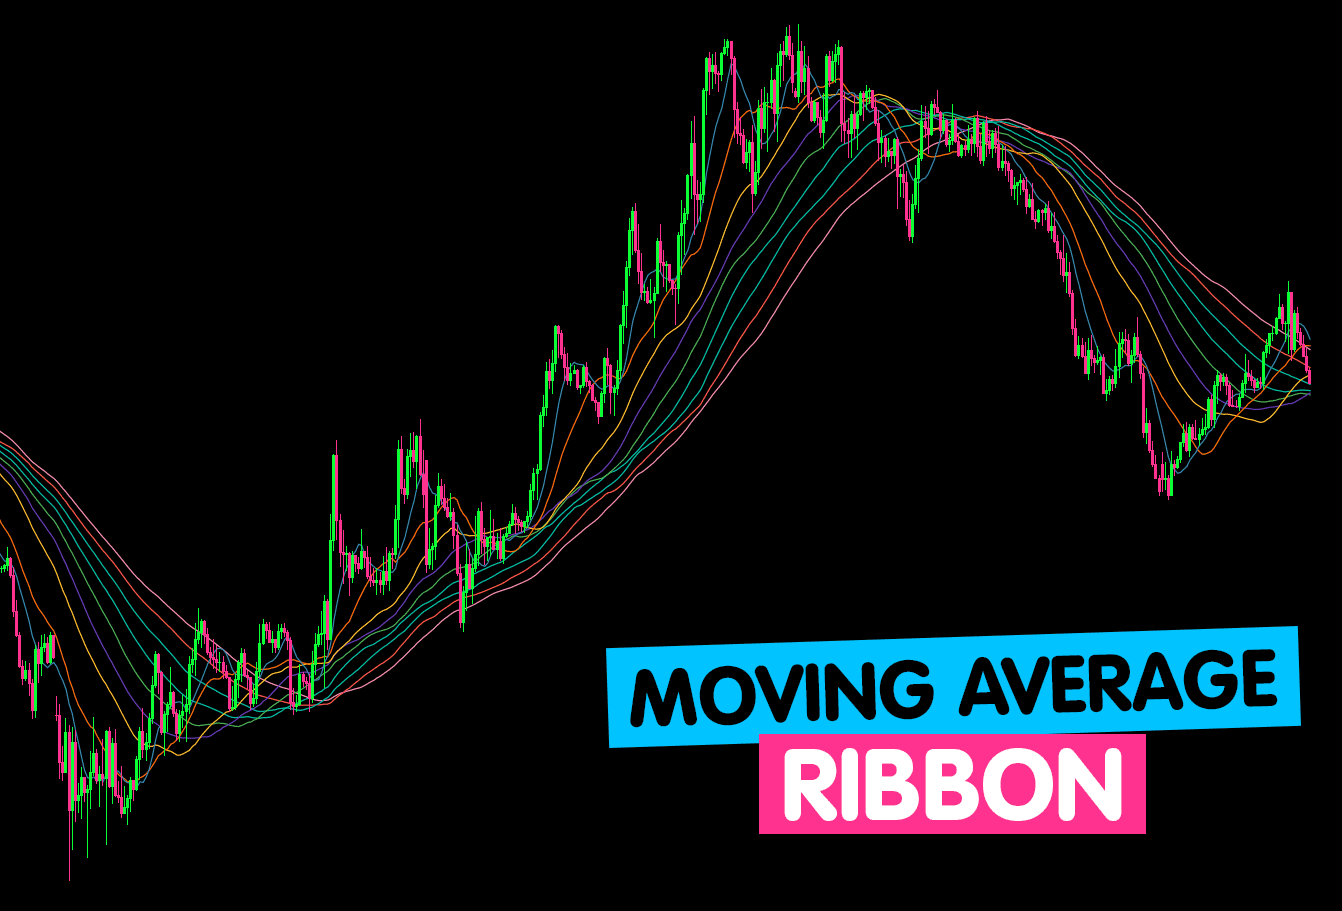
Table content
I. Understanding the Moving Average Ribbon Indicator
II. Approaches for Trading with the Moving Average Ribbon Indicator
1. Trend Identification and Confirmation
2. Crossovers and Entry Points
3. Ribbon Expansion and Contraction
4. Reversal Signals
5. Support and Resistance Levels
6. Combining with Other Indicators
III. Risk Management and Final Thoughts
IV. Footnote
Understanding the Moving Average Ribbon Indicator
The Moving Average Ribbon is a technical indicator that consists of multiple moving averages of different periods displayed on a price chart. These moving averages are layered on top of each other, creating a ribbon-like appearance. Each moving average in the ribbon represents a specific time frame, ranging from short-term to long-term. The ribbon's goal is to provide traders with a clearer picture of the market's trend and direction by smoothing out price fluctuations over various time frames.
The primary advantage of using the Moving Average Ribbon is its ability to filter out short-term market noise and identify more sustained trends. By combining multiple moving averages, traders can better comprehend the overall trend dynamics and make more informed trading decisions.
Approaches for Trading with the Moving Average Ribbon Indicator
1. Trend Identification and Confirmation: One of the fundamental uses of the Moving Average Ribbon is to identify trends and confirm their strength. When the ribbon slopes upward with shorter-term moving averages positioned above longer-term ones, it indicates a strong bullish trend. Conversely, a downward-sloping ribbon with short-term moving averages beneath long-term ones signifies a strong bearish trend. This confirmation of trend direction can guide traders in aligning their trades with the prevailing market sentiment.
2. Crossovers and Entry Points: Crossovers of moving averages within the ribbon can serve as potential entry points. When the shorter-term moving averages cross above the longer-term ones, it suggests a potential bullish entry signal, indicating that the trend might be shifting upwards. On the other hand, when the shorter-term moving averages cross below the longer-term ones, it could indicate a bearish entry signal.
3. Ribbon Expansion and Contraction: The spacing between the moving averages in the ribbon can reveal the market's momentum. During a strong trend, the ribbon tends to expand as the price moves decisively in one direction. Conversely, during periods of consolidation or weaker trends, the ribbon may contract as the price range narrows. Traders can use these signals to gauge the market's volatility and adjust their trading strategies accordingly.
4. Reversal Signals: The Moving Average Ribbon can also offer insights into potential trend reversals. When the ribbon starts to flatten or the moving averages begin to overlap, it might indicate that the current trend is losing momentum. This could be a precursor to a trend reversal, prompting traders to exercise caution or consider potential counter-trend trades.
5. Support and Resistance Levels: In addition to trend identification, the Moving Average Ribbon can help traders identify potential support and resistance levels. When the price approaches the ribbon and bounces off it, the ribbon acts as a dynamic support or resistance zone. This can aid traders in setting stop-loss levels or profit targets more effectively.
6. Combining with Other Indicators: While the Moving Average Ribbon is powerful on its own, combining it with other technical indicators can enhance its effectiveness. Traders often pair it with oscillators like the Relative Strength Index (RSI) or the Moving Average Convergence Divergence (MACD) to gain more comprehensive insights into market conditions before making trading decisions.
Risk Management and Final Thoughts
While the Moving Average Ribbon indicator offers valuable insights, it's crucial to remember that no trading strategy is foolproof. Forex trading involves inherent risks, and even the most sophisticated indicators cannot guarantee profits. Therefore, risk management remains an integral part of any trading strategy.
Traders using the Moving Average Ribbon should consider setting appropriate stop-loss and take-profit levels to protect their capital. Additionally, they should avoid overtrading and stick to their trading plan, which incorporates their risk tolerance and investment goals.
Footnote
In summary, the Moving Average Ribbon indicator is a versatile tool that can significantly aid forex traders in identifying trends, momentum shifts, and potential reversal points. Its ability to smooth out short-term price fluctuations and provide a clearer view of market dynamics is invaluable for making informed trading decisions. By applying the various approaches discussed in this article – from trend identification to entry points and reversal signals – traders can harness the power of the Moving Average Ribbon to enhance their trading strategies. However, traders must always exercise caution, practice sound risk management, and continually educate themselves to adapt to the ever-changing forex market.


Discussion