

Forex Trading Strategies for Using the MACD Indicator: Approaches for Trading with the Moving Average Convergence Divergence Indicator
In the world of forex trading, mastering technical analysis is essential for success. Among the plethora of indicators available, the Moving Average Convergence Divergence (MACD) stands as one of the most popular and widely used tools. Its ability to provide insights into trends, momentum, and potential reversals makes it a favorite among both novice and experienced traders. In this article, we will delve into various strategies for effectively utilizing the MACD indicator to enhance your forex trading outcomes.
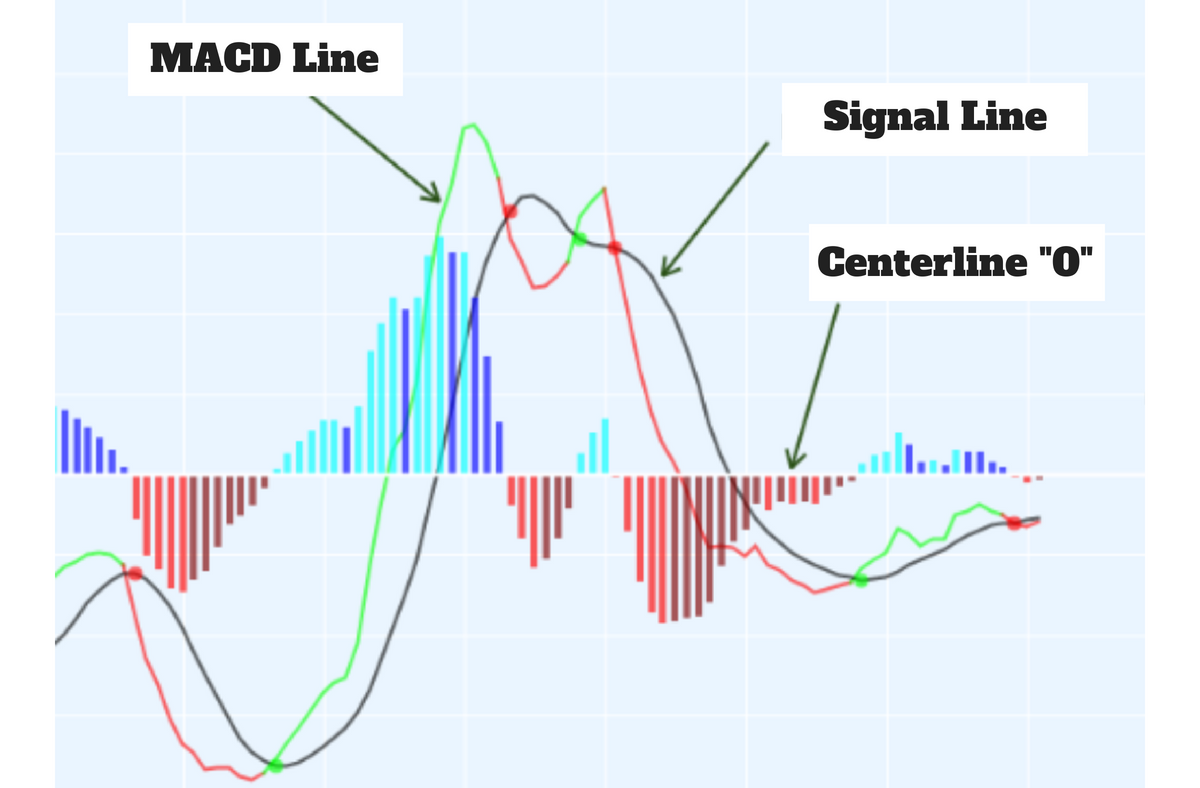
Table Content
I. Understanding the MACD Indicator
1) MACD Line
2) Signal Line
3) Histogram
II. MACD as a Trend Indicator
1: MACD Crossovers
2: MACD Histogram
III. Using MACD for Divergence
1: Regular Divergence
2: Hidden Divergence
IV. MACD and Support/Resistance
a: MACD Breakout
b: MACD Bounce
V. Risk Management and Using MACD
VI. Setting Stop-Loss and Take-Profit
VII. Final Thoughts
Understanding the MACD Indicator:
Before delving into strategies, it's crucial to grasp the fundamentals of the MACD indicator. Developed by Gerald Appel in the late 1970s, the MACD is a trend-following momentum indicator that consists of three components: the MACD line, the signal line, and the histogram.
1) MACD Line: The MACD line is calculated by subtracting the 26-period exponential moving average (EMA) from the 12-period EMA. This line represents the difference between short-term and long-term price trends.
2) Signal Line: The signal line is the 9-period EMA of the MACD line. It acts as a trigger for buy and sell signals.
3) Histogram: The histogram is a visual representation of the difference between the MACD line and the signal line. It helps traders identify the strength of the momentum in a trend.
MACD as a Trend Indicator:
One of the most straightforward uses of the MACD indicator is identifying trends. By observing the relationship between the MACD line and the signal line, traders can gain insights into the strength and direction of a trend.
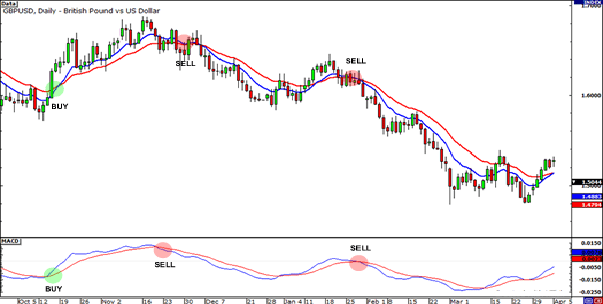
1: MACD Crossovers
The MACD crossover strategy revolves around the interaction between the MACD line and the signal line. When the MACD line crosses above the signal line, it generates a bullish signal, indicating a potential upward trend. Conversely, when the MACD line crosses below the signal line, a bearish signal suggests a possible downward trend. Traders often use these crossovers to time their entries and exits.
2: MACD Histogram
The histogram, created by the difference between the MACD line and the signal line, provides valuable information about the momentum of a trend. A rising histogram indicates strengthening momentum, while a declining histogram suggests waning momentum. Traders can use histogram patterns to confirm trend direction and gauge potential reversals.
Using MACD for Divergence:
Divergence occurs when the price of a currency pair and an indicator move in opposite directions. MACD divergence is a powerful tool for spotting potential trend reversals.
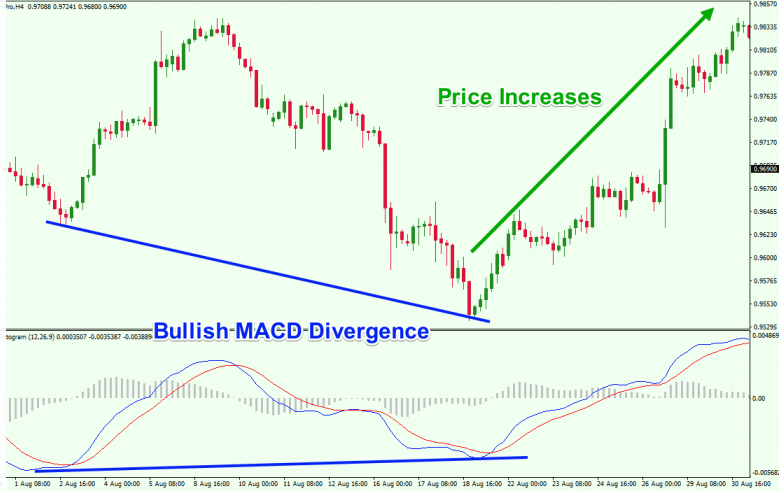
1: Regular Divergence
Regular bullish divergence occurs when the price forms lower lows, but the MACD forms higher lows. This suggests that although the price is indicating a downtrend, the momentum might be shifting towards a bullish reversal. Regular bearish divergence is the opposite scenario, indicating a potential bearish reversal when the price forms higher highs, but the MACD forms lower highs.
2: Hidden Divergence
Hidden bullish divergence takes place when the price forms higher lows, while the MACD forms lower lows. This indicates that even though the price is in a downtrend, the momentum is potentially gearing up for a bullish move. Hidden bearish divergence, on the other hand, occurs when the price forms lower highs, but the MACD forms higher highs, suggesting a potential continuation of a bearish trend despite temporary price highs.
MACD and Support & Resistance:
The MACD indicator can also be used in conjunction with support and resistance levels to improve the accuracy of trading decisions.
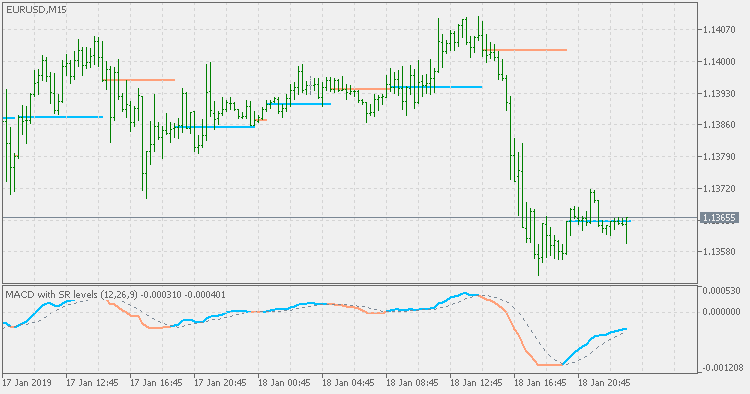
a: MACD Breakout
Traders often wait for a breakout above a strong resistance level confirmed by a bullish MACD crossover. This dual confirmation strengthens the signal, increasing the probability of a successful trade.
b: MACD Bounce
Similarly, traders can wait for a bounce off a well-established support level, confirmed by a bearish MACD crossover. This combination reinforces the likelihood of a downward move, enhancing the trade setup.
Risk Management and Using MACD:
No trading strategy is complete without proper risk management. The MACD indicator can aid in setting stop-loss and take-profit levels.
Setting Stop-Loss and Take-Profit
When using the MACD, traders can place their stop-loss orders below the recent swing low for a bullish trade and above the recent swing high for a bearish trade. This approach provides a logical point at which the trade setup might be invalidated. Take-profit levels can be set based on significant support and resistance zones or by using a risk-to-reward ratio.
Final Thoughts:
The Moving Average Convergence Divergence (MACD) indicator is a versatile tool that offers valuable insights into trends, momentum, and potential reversals in the forex market. Traders can employ a variety of strategies to harness the power of the MACD, from identifying trend crossovers and using histogram patterns to recognizing regular and hidden divergences. Integrating the MACD with support and resistance levels and incorporating sound risk management practices can significantly enhance the effectiveness of these strategies.
As with any trading approach, it's essential to practice and refine your strategies using historical data or in a demo trading environment before implementing them in live markets. Additionally, combining the MACD with other technical indicators or fundamental analysis can provide a more comprehensive view of the market, ultimately leading to more informed trading decisions. Remember that successful trading requires discipline, continuous learning, and adaptability to changing market conditions.


Discussion