
Forex trading strategies for using the Ichimoku cloud: Approaches for trading with the Ichimoku Kinko Hyo indicator.
In the fast-paced world of forex trading, where volatility and uncertainty reign supreme, having a reliable and versatile trading strategy is essential for success. One such strategy that has gained popularity among traders is the use of the Ichimoku Kinko Hyo indicator, commonly referred to as the Ichimoku Cloud. This Japanese technical analysis tool offers a holistic approach to assessing market trends, support and resistance levels, and potential entry and exit points. In this article, we will delve into the intricacies of the Ichimoku Cloud and explore various trading approaches that traders can adopt to enhance their trading performance.
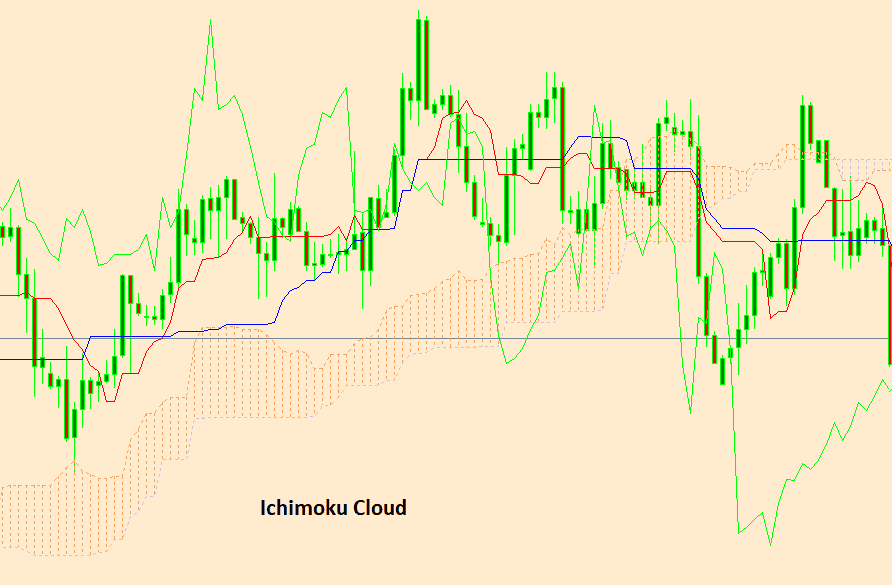
Table Content
I. Understanding the Ichimoku Kinko Hyo Indicator
1. Tenkan-sen (Conversion Line)
2. Kijun-sen (Base Line)
3. Senkou Span A (Leading Span A)
4. Senkou Span B (Leading Span B)
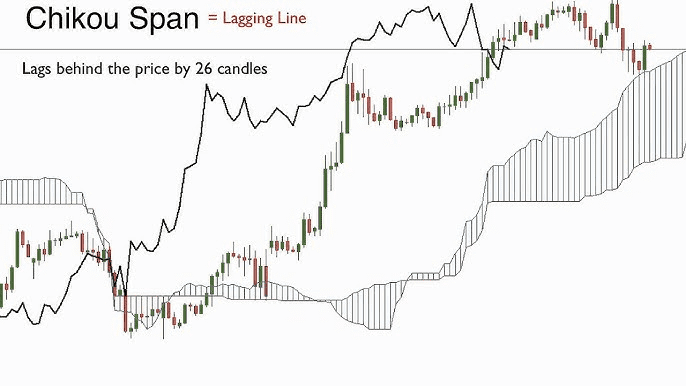
5. Chikou Span (Lagging Span)
6. Kumo (Cloud)
II. Trading Approaches Using the Ichimoku Cloud
1. Trend Identification
2. Cloud Breakouts
3. Cloud Thickness
4. Kumo Twists
5. Chikou Span Confirmation
III. Risk Management
IV. Footnote
Understanding the Ichimoku Kinko Hyo Indicator:
Developed by Goichi Hosoda in the late 1960s, the Ichimoku Kinko Hyo indicator is a comprehensive trading tool that provides insights into market trends, momentum, and potential reversal points. The name "Ichimoku Kinko Hyo" translates to "one glance equilibrium chart" in English, highlighting the indicator's ability to provide a comprehensive overview of price action dynamics in a single glance.
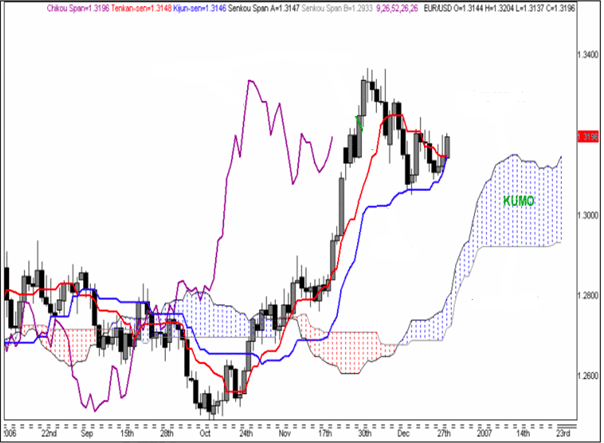
The Ichimoku Cloud consists of five lines and a shaded region known as the "cloud" or "Kumo." These components work together to offer a multidimensional perspective of the market:
1. Tenkan-sen (Conversion Line): This line is calculated as the average of the highest high and lowest low over a specific period, often set to 9 periods. It provides insights into short-term momentum and can be compared to a fast-moving moving average.
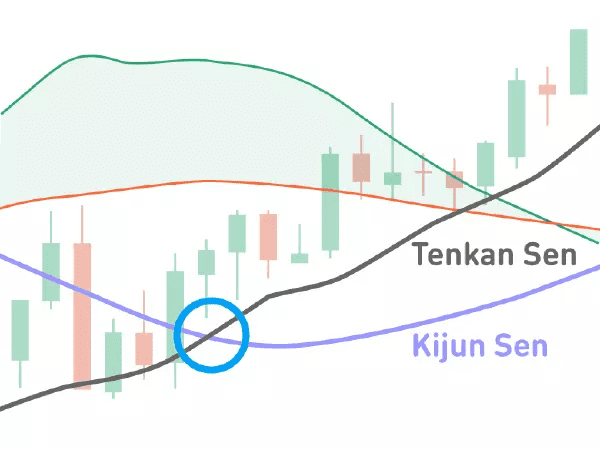
2. Kijun-sen (Base Line): Similar to the Tenkan-sen, the Kijun-sen is calculated as the average of the highest high and lowest low, but over a longer period, typically 26 periods. It offers insights into medium-term momentum and acts as a slower-moving moving average.
3. Senkou Span A (Leading Span A): This line represents the midpoint of the Tenkan-sen and Kijun-sen, projected 26 periods into the future. It forms the upper boundary of the cloud.
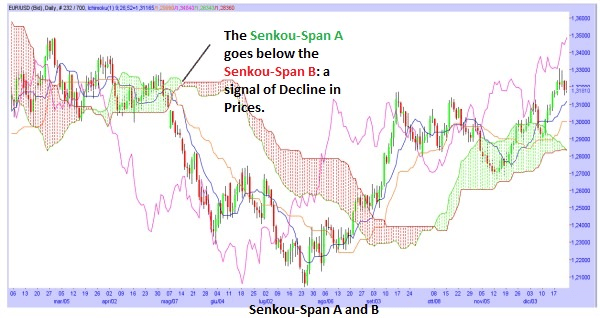
4. Senkou Span B (Leading Span B): Calculated as the average of the highest high and lowest low over a longer period (usually 52 periods), this line is projected 26 periods into the future and forms the lower boundary of the cloud.
5. Chikou Span (Lagging Span): The Chikou Span is the current closing price plotted 26 periods back on the chart. It helps traders identify potential support and resistance levels.
6. Kumo (Cloud): The area between Senkou Span A and Senkou Span B is shaded, creating the cloud. The cloud represents future support and resistance levels, with thicker clouds indicating stronger levels.
Trading Approaches Using the Ichimoku Cloud:
1. Trend Identification: One of the primary uses of the Ichimoku Cloud is to identify trends and determine their strength. When the price is above the cloud, it indicates a bullish trend, while a price below the cloud signifies a bearish trend. Additionally, the relative positioning of the Tenkan-sen and Kijun-sen provides insights into the momentum of the trend. A bullish crossover (Tenkan-sen crossing above Kijun-sen) suggests increasing bullish momentum, while a bearish crossover implies growing bearish momentum.
2. Cloud Breakouts: Traders often look for price breakouts above or below the cloud to identify potential entry points. A bullish breakout above the cloud could indicate a shift from a bearish to a bullish trend, while a bearish breakout below the cloud might signal a reversal to a bearish trend.
3. Cloud Thickness: The thickness of the cloud is a visual representation of the support or resistance strength at a particular level. Thicker clouds indicate stronger support or resistance. Traders can use this information to set stop-loss levels and take-profit targets.
4. Kumo Twists: A Kumo twist occurs when Senkou Span A crosses above or below Senkou Span B. This event can signal a potential shift in trend direction. A bullish Kumo twist occurs when Senkou Span A crosses above Senkou Span B, while a bearish Kumo twist happens when Senkou Span A crosses below Senkou Span B.
5. Chikou Span Confirmation: Traders often use the Chikou Span to confirm potential signals generated by other components of the Ichimoku Cloud. For example, if the Chikou Span crosses above the price, it could validate a bullish signal.
Risk Management:
While the Ichimoku Cloud offers valuable insights into market trends and potential trading opportunities, no trading strategy is foolproof. Risk management remains a crucial aspect of successful trading. Traders should always use appropriate position sizing, set stop-loss orders, and avoid risking more than a small percentage of their trading capital on a single trade.
Footnote:
In summary, the Ichimoku Kinko Hyo indicator, with its multi-dimensional approach to analyzing price action, has proven to be a valuable tool for forex traders. By integrating various components like the Tenkan-sen, Kijun-sen, Senkou Span A and B, Chikou Span, and the Kumo, traders can gain a holistic perspective on market trends, momentum, and potential reversal points. Whether used for trend identification, breakout strategies, or confirmation of other signals, the Ichimoku Cloud provides traders with a versatile toolkit to navigate the complex world of forex trading. As with any trading strategy, thorough testing, continuous learning, and disciplined risk management are key to achieving success in the forex market using the Ichimoku Kinko Hyo indicator.


Discussion