

Forex trading strategies for using the Harmonic Shark pattern: Techniques for trading with the Harmonic Shark pattern.
In the vast and dynamic world of forex trading, success often hinges on the ability to identify and capitalize on various patterns that the market presents. One such powerful pattern is the Harmonic Shark pattern, an advanced trading tool that can offer traders an edge in their pursuit of profitable trades. In this article, we delve into the techniques for trading with the Harmonic Shark pattern, exploring its significance, identification, and strategies to make informed trading decisions.
Table Content
I. Understanding the Harmonic Shark Pattern
1. X
2. A
3. B
4. C
5. D
II. Identifying the Harmonic Shark Pattern
III. Manual Identification
1. Draw Trendlines
2. Fibonacci Retracements and Extensions
IV. Automated Identification
1. Trading Software
2. Custom Indicators
V. Techniques for Trading with the Harmonic Shark Pattern
1. Confirming Confluence
2. Wait for Completion
3. Entry Strategies
4. Stop Loss and Take Profit
5. Trail Stop
6. Timeframes and Market Conditions
7. Back testing and Practice
V. Real-World Example: Applying the Harmonic Shark Pattern
VI. Footnote
Understanding the Harmonic Shark Pattern
The Harmonic Shark pattern is a relatively newer entrant to the realm of harmonic trading patterns, yet it holds immense potential for traders who seek to predict potential price reversals with accuracy. This pattern is a variation of the broader family of harmonic patterns, which are geometric price formations that highlight potential reversal points in the market. The Shark pattern, discovered by Scott Carney, stands out due to its unique shape and Fibonacci-based structure.
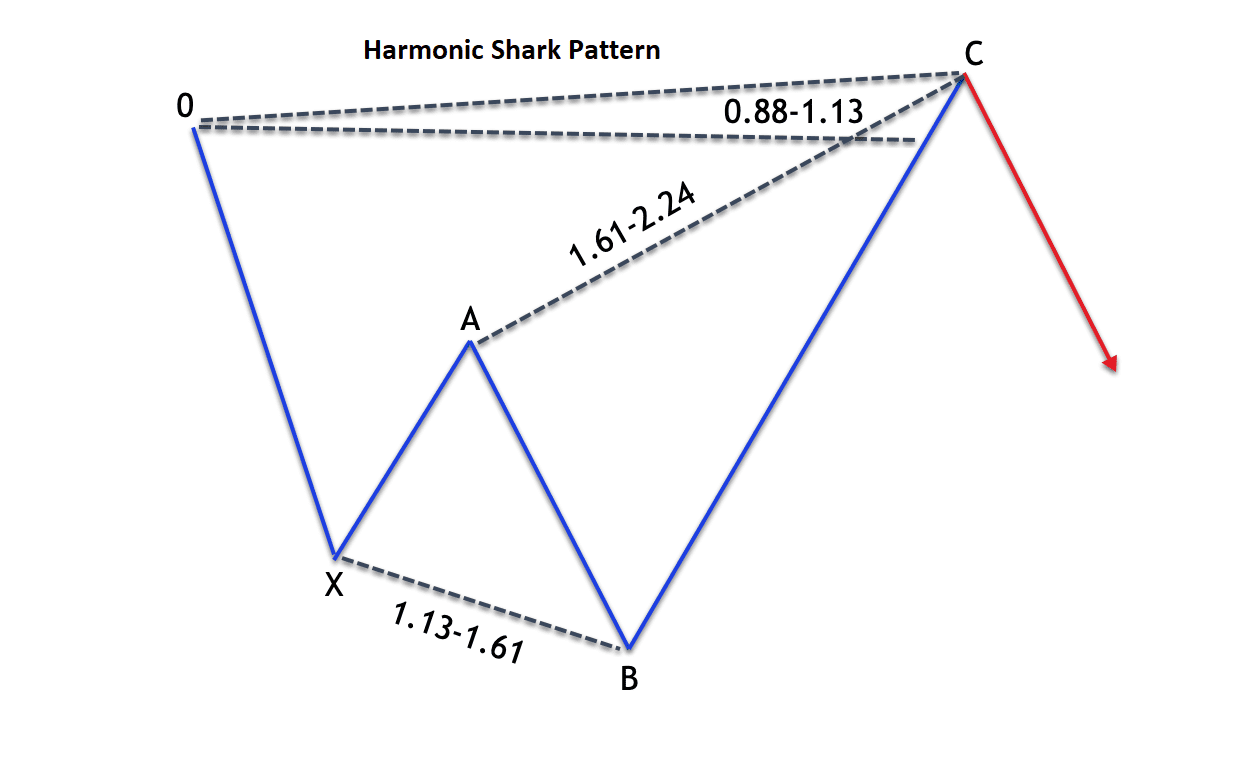
The Shark pattern consists of five primary points: X, A, B, C, and D. Here's a breakdown of these points:
1. X: This point marks the start of the pattern and is where the initial price impulse begins.
2. A: Following the X point, there is a price retracement, typically around 0.786 Fibonacci level of the XA leg.
3. B: The price then moves in the direction of the initial impulse (XA), often reaching the 1.13 to 1.618 Fibonacci extension of the XA leg.
4. C: At this point, the price undergoes a deeper retracement, approximately around the 0.886 Fibonacci level of the BC leg.
5. D: Finally, the price completes its journey with a move from point C to point D, ideally aligning with the 1.618 to 2.24 Fibonacci extension of the XA leg. This move forms the potential reversal zone (PRZ).
Identifying the Harmonic Shark Pattern:
Accurate identification of the Harmonic Shark pattern is crucial for effective trading. While it may appear complex at first glance, modern trading platforms and charting software have made pattern recognition significantly more accessible. Traders can employ both manual and automated methods to spot the Shark pattern.
Manual Identification:
1. Draw Trendlines: Begin by drawing trendlines connecting points X and A, as well as points X and D. This helps establish the potential PRZ.
2. Fibonacci Retracements and Extensions: Plot Fibonacci retracement levels from X to A, and Fibonacci extension levels from B to D. These levels will guide you in determining if the pattern's criteria are met.
Automated Identification:
1. Trading Software: Many trading platforms offer built-in tools that can automatically detect harmonic patterns. Traders can set parameters and filters to customize the pattern detection process.
2. Custom Indicators: Some traders use custom indicators designed to spot harmonic patterns. These indicators can enhance the accuracy of pattern recognition.
Techniques for Trading with the Harmonic Shark Pattern:
Trading with the Harmonic Shark pattern involves a multi-step process that combines pattern identification with risk management and strategic entry and exit points. Here are techniques to consider when trading this pattern:
1. Confirming Confluence: For increased accuracy, seek confluence with other technical tools. This could include support and resistance levels, moving averages, or other established patterns. The confluence of multiple factors can strengthen the validity of your trading decision.
2. Wait for Completion: Exercise patience and wait for the pattern to complete before taking any action. This means waiting for the price to reach point D, the potential reversal zone. Entering trades prematurely can lead to false signals.
3. Entry Strategies: Traders often employ different entry strategies based on their risk appetite. Some may enter the trade as soon as the price reaches the PRZ, while others might wait for additional confirmation signals such as candlestick patterns or momentum indicators.
4. Stop Loss and Take Profit: Implementing proper risk management is essential. Place your stop-loss orders beyond the PRZ, allowing for potential market noise. Take-profit levels can be set at logical price levels, like previous support or resistance areas.
5. Trail Stop: As the price moves in your favor, consider trailing your stop loss to lock in profits. This technique allows you to capture more gains if the market continues to move favorably.
6. Timeframes and Market Conditions: Harmonic patterns, including the Shark pattern, can be applied to various timeframes. However, remember that smaller timeframes might yield more frequent but less reliable signals. Additionally, consider the overall market conditions – patterns are more effective in trending markets than in choppy or sideways ones.
7. Back testing and Practice: Before implementing the Harmonic Shark pattern in live trading, conduct thorough back testing on historical data to assess its effectiveness. Practicing on demo accounts can help you refine your skills without risking real capital.
Real-World Example: Applying the Harmonic Shark Pattern:
Let's walk through a hypothetical example of applying the Harmonic Shark pattern to a real-world forex trading scenario:
Suppose you're analyzing the EUR/USD currency pair on the daily timeframe. You identify a potential Harmonic Shark pattern forming, with the following key levels:
- XA: 1.1200 to 1.1400
- AB: 1.1400 to 1.1300
- BC: 1.1300 to 1.1000
- CD: 1.1000 to 1.0800
The PRZ aligns with the 1.0800 level. You decide to wait for the pattern to complete and for additional confirmation. As the price reaches the PRZ, you notice a bullish engulfing candlestick pattern, signaling potential upward movement.
You set your entry slightly above the PRZ at 1.0820, with a stop-loss order at 1.0780, just below the PRZ. Your take-profit level is set at 1.0950, a previous resistance level.
As the trade progresses, the price moves in your favor, and you decide to trail your stop loss
to 1.0880 to secure some profits. Eventually, the price reaches your take-profit level, and the trade closes with a satisfying gain.
Footnote:
The Harmonic Shark pattern is a potent tool in the arsenal of forex traders, offering a structured approach to identifying potential price reversals. By mastering its identification, entry and exit strategies, and risk management techniques, traders can harness the power of this pattern to improve their trading outcomes. However, like any trading strategy, the Harmonic Shark pattern is not foolproof and requires continuous learning, practice, and adaptation to changing market conditions. As you embark on your journey to incorporate this pattern into your trading repertoire, remember that prudent risk management and a disciplined approach are key to success in the dynamic forex market.


Discussion