

Forex trading strategies for using the Harmonic Bearish Butterfly pattern: Approaches for trading with the Harmonic Bearish Butterfly pattern.
In the ever-evolving landscape of forex trading, traders continually seek effective strategies that can provide them with a competitive edge in the market. One such strategy that has gained popularity over the years is trading with harmonic patterns. Among these patterns, the Harmonic Bearish Butterfly pattern stands out as a powerful tool for identifying potential reversals and maximizing profit opportunities. In this article, we will delve into the intricacies of the Harmonic Bearish Butterfly pattern and explore various approaches for trading with this pattern.
Table Content
I. Understanding the Harmonic Bearish Butterfly Pattern
II. Approaches for Trading with the Harmonic Bearish Butterfly Pattern
1. Pattern Confirmation with Additional Indicators
2. Wait for Price Action Confirmation
3. Implementing Risk Management and Trade Execution
III. Case Study: Applying Harmonic Bearish Butterfly Pattern in Action
1. Identifying the Pattern
2. Confirmation
3. Entry and Risk Management
4. Target and Exit
IV. Footnote
Understanding the Harmonic Bearish Butterfly Pattern
Harmonic patterns are a unique subset of technical analysis that focuses on price patterns formed by Fibonacci retracements and extensions. The Harmonic Bearish Butterfly pattern is a specific configuration that signals a potential trend reversal from a bullish move to a bearish move. This pattern is defined by five key points: X, A, B, C, and D.
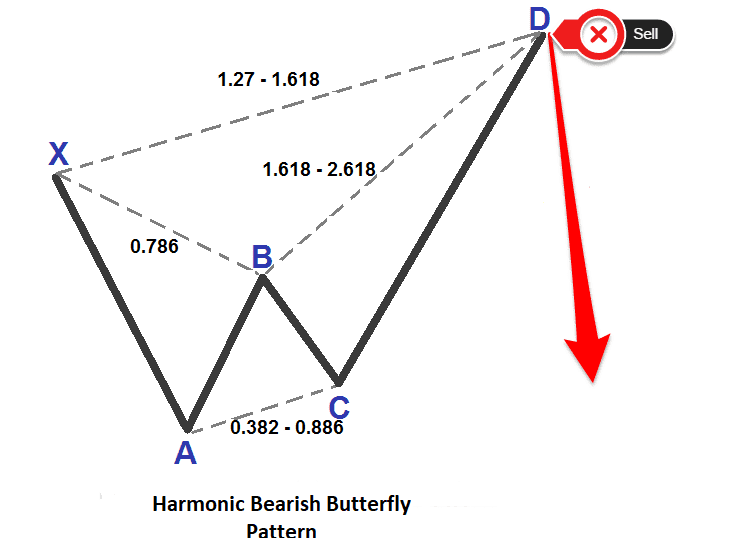
- X: This point represents the start of the pattern and corresponds to the initial high point of the trend.
- A: The first significant retracement from point X. It is typically a lower high.
- B: The retracement from point A, forming a higher low.
- C: The point at which the price reverses again, typically from the retracement of AB. This forms a lower high.
- D: The terminal point of the pattern. It is the level at which the price is expected to reverse again, completing the formation. Point D is ideally situated at the 127.2% Fibonacci extension of the XA leg and the 161.8% Fibonacci extension of the AB leg.
The Bearish Butterfly pattern signifies a potential reversal from an existing bullish trend, making it a valuable tool for traders aiming to capitalize on trend exhaustion and subsequent price corrections.
Approaches for Trading with the Harmonic Bearish Butterfly Pattern
Trading with harmonic patterns demands a comprehensive understanding of price action and the interplay of Fibonacci levels. Here, we explore three effective approaches to harness the potential of the Harmonic Bearish Butterfly pattern.
1. Pattern Confirmation with Additional Indicators
While the Harmonic Bearish Butterfly pattern itself can offer a strong indication of a potential reversal, confirming signals from additional technical indicators can enhance the reliability of the trade setup. Traders often employ tools such as the Relative Strength Index (RSI), Moving Averages, and the MACD (Moving Average Convergence Divergence) to validate the strength of the impending reversal. For instance, a convergence of the Bearish Butterfly pattern's completion at point D with a bearish divergence on the RSI can offer a stronger basis for initiating a short trade.
2. Wait for Price Action Confirmation
Successful trading requires a blend of technical and fundamental analysis. With the Harmonic Bearish Butterfly pattern, traders can benefit from waiting for confirmation through price action. This involves monitoring how price behaves around point D before entering a trade. Traders may look for candlestick patterns like bearish engulfing patterns, shooting stars, or hammers that align with the anticipated reversal. Waiting for such price action signals adds a layer of confidence, as it demonstrates that market participants are responding to the pattern.
3. Implementing Risk Management and Trade Execution
Trading any pattern, including the Harmonic Bearish Butterfly, involves a degree of risk. Therefore, effective risk management is essential to protect capital and preserve gains. Traders often set stop-loss orders just above point D, allowing a small margin for potential fluctuations that do not invalidate the pattern. Moreover, implementing a favorable risk-to-reward ratio, such as 1:2 or higher, ensures that potential losses are outweighed by potential gains, even if not all trades result in profits.
Case Study: Applying Harmonic Bearish Butterfly Pattern in Action
To illustrate the practical application of the Harmonic Bearish Butterfly pattern, let's consider a hypothetical scenario involving the EUR/USD currency pair.
1. Identifying the Pattern: After a prolonged bullish trend, the EUR/USD pair exhibits signs of exhaustion. The trader identifies the Harmonic Bearish Butterfly pattern forming on the chart, with point D lining up around a key resistance level.
2. Confirmation: The trader observes a bearish divergence on the RSI, indicating weakening bullish momentum. Additionally, a bearish engulfing candle forms right at point D, providing further confirmation of a potential reversal.
3. Entry and Risk Management: The trader decides to enter a short trade at the close of the bearish engulfing candle, which also coincides with the completion of the Harmonic Bearish Butterfly pattern. A stop-loss order is placed just above point D, mitigating potential losses if the trade goes against the anticipated direction.
4. Target and Exit: The trader identifies a logical target based on recent support levels, offering a favorable risk-to-reward ratio of 1:3. Once the price reaches this level, the trader exits the trade, banking profits.
Footnote
The Harmonic Bearish Butterfly pattern presents traders with a unique opportunity to identify potential reversals and profit from corrective price movements. By combining technical analysis, fundamental insights, and risk management strategies, traders can increase their likelihood of success when trading this pattern. It's important to note that, like any trading strategy, the Harmonic Bearish Butterfly pattern is not foolproof and requires disciplined execution and continuous learning.
As with all trading strategies, traders should practice due diligence, conduct thorough analysis, and consider the broader market context before executing trades based on the Harmonic Bearish Butterfly pattern. By doing so, traders can harness the power of this pattern and navigate the forex markets with increased confidence and proficiency.


Discussion