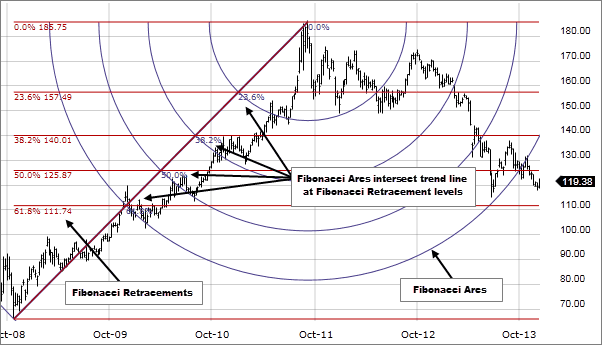
Forex trading strategies for using the Fibonacci Arcs: Approaches for trading with the Fibonacci Arcs tool.
In the realm of forex trading, success often hinges on the utilization of robust strategies and tools that can provide traders with an edge in deciphering market trends and making informed decisions. One such tool that has garnered significant attention is the Fibonacci Arcs. Derived from the famous Fibonacci sequence, these arcs offer traders a unique way to identify potential support and resistance levels, aiding in the development of well-informed trading strategies. In this article, we delve into the world of forex trading strategies using the Fibonacci Arcs, exploring various approaches that traders can adopt to enhance their trading prowess.
Table Content
I. Understanding the Fibonacci Arcs
II. Trading Strategies Utilizing Fibonacci Arcs
1. Arcs Intersection Strategy
2. Arcs as Dynamic Support and Resistance
3. Combining Fibonacci Arcs with Other Indicators
4. Arcs in Confluence with Chart Patterns
5. The Trend-Following Approach
6. Using Multiple Timeframes
III. Risk Management and Trade Execution
IV. Footnote
Understanding the Fibonacci Arcs:
Before delving into the strategies, it's essential to comprehend the basics of Fibonacci Arcs. The Fibonacci sequence is a mathematical pattern where each number is the sum of the two preceding ones (e.g., 0, 1, 1, 2, 3, 5, 8, and so on). When these numbers are applied to trading, they help identify potential retracement levels after a price movement. The Fibonacci Arcs are derived from the Fibonacci retracement levels and are drawn as curved lines that radiate from a pivot point, usually a significant high or low on a price chart.

The arcs are drawn at specific Fibonacci ratios (often 38.2%, 50%, and 61.8%) and can help traders identify potential areas of support and resistance. The 38.2% arc represents a shallow pullback level, the 50% arc signifies a potential reversal point, and the 61.8% arc suggests a strong retracement level.
Trading Strategies Utilizing Fibonacci Arcs:
1. Arcs Intersection Strategy:
One effective approach to trading with Fibonacci Arcs involves identifying points where multiple arcs intersect. These intersections can indicate areas where price is likely to react, making them potential entry or exit points. For instance, if the 38.2% arc intersects with the 61.8% arc near a recent price high, it may suggest a strong resistance level. Traders can use this information to execute short trades with appropriate risk management.
2. Arcs as Dynamic Support and Resistance:
Fibonacci Arcs can also be used as dynamic support and resistance levels. As price evolves, the arcs change their positions, offering traders a dynamic perspective on potential reversal or continuation areas. If the price consistently bounces off a specific arc, it confirms its effectiveness as a support or resistance level. Traders can then incorporate this information into their strategies, using these levels as reference points for placing orders.
3. Combining Fibonacci Arcs with Other Indicators:
To enhance the accuracy of their trading strategies, traders often combine Fibonacci Arcs with other technical indicators. This fusion of tools can provide a more comprehensive view of the market, reducing the likelihood of false signals. Commonly paired indicators include Moving Averages, Relative Strength Index (RSI), and MACD (Moving Average Convergence Divergence). By waiting for signals from both Fibonacci Arcs and other indicators to align, traders can filter out less reliable trades and focus on higher-probability setups.
4. Arcs in Confluence with Chart Patterns:
Chart patterns, such as head and shoulders, triangles, and flags, are widely used in technical analysis. Integrating Fibonacci Arcs with these patterns can yield powerful insights. When the arcs align with a pattern's support or resistance lines, it adds weight to the potential significance of that level. This confluence can help traders confirm their analysis and execute trades with greater confidence.
5. The Trend-Following Approach:
Traders often align their strategies with the prevailing market trend to maximize their chances of success. Fibonacci Arcs can be instrumental in this regard. During an uptrend, for example, traders can wait for price retracements that touch or come close to the 50% arc. This aligns with the idea of buying the dip in a strong trend. Similarly, during a downtrend, traders can look for price bounces near the 50% arc as potential short opportunities.
6. Using Multiple Timeframes:
Fibonacci Arcs' effectiveness can vary across different timeframes. What might appear as a significant level on a shorter timeframe might be less influential on a higher timeframe. By analyzing Fibonacci Arcs across multiple timeframes, traders can identify levels that carry more weight due to their alignment on various scales. This approach provides a more holistic view of the market dynamics.
Risk Management and Trade Execution:
While these strategies offer valuable insights, it's crucial to highlight the importance of risk management and disciplined trade execution. Regardless of the strategy used, traders should implement proper risk-reward ratios, set stop-loss orders, and avoid overleveraging their positions. The volatile nature of forex trading demands that traders preserve their capital and maintain a long-term perspective.
Footnote:
The world of forex trading is dynamic and challenging, but armed with the right tools and strategies, traders can navigate it successfully. Fibonacci Arcs, derived from the revered Fibonacci sequence, provide traders with a unique way to identify potential support and resistance levels. By incorporating the various approaches outlined in this article, traders can harness the power of Fibonacci Arcs to enhance their decision-making and trading outcomes. Remember, no strategy guarantees success, and continuous learning, adaptability, and prudent risk management remain the pillars of a trader's journey toward profitability.


Discussion