Forex Trading Strategies for Using the Double Top Pattern: Techniques for Trading with the Double Top Chart Pattern
Forex trading involves the art of interpreting various chart patterns to make informed trading decisions. Among the plethora of patterns that traders use, the double top pattern stands out as a reliable indicator of potential trend reversals. This pattern is a favorite among traders due to its simplicity and effectiveness in identifying potential market reversals. In this article, we will delve into the intricacies of the double top pattern, discuss its significance, and explore effective trading strategies to make the most out of this chart pattern.
Table Content
I. Understanding the Double Top Pattern
II. Key Components of the Double Top Pattern
1. First Peak
2. Trough
3. Second Peak
4. Neckline
III. Trading Strategies with the Double Top Pattern
1. Confirmation is Key
2. Measuring Price Targets
3. Volume Analysis
4. Risk Management
5. Combining with Other Indicators
6. Timeframes Matter
7. Practice and Back-testing
IV. Footnote
Understanding the Double Top Pattern
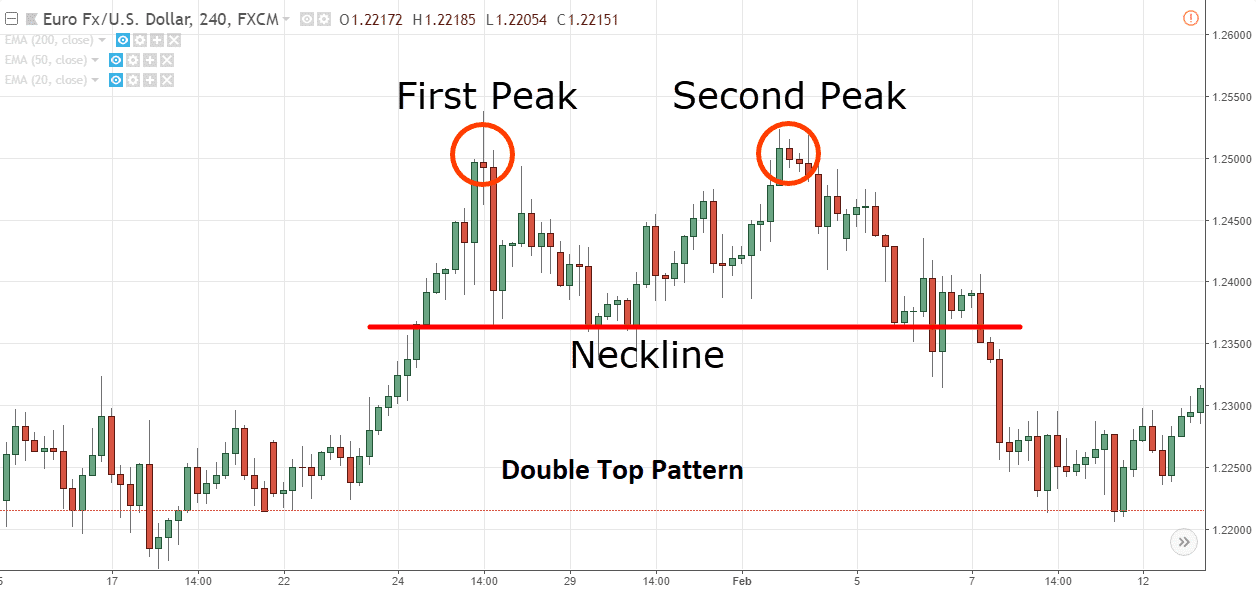
The double top pattern is a bearish reversal pattern that forms after an uptrend. It consists of two distinct peaks (or tops) that reach a similar price level, followed by a noticeable decline in price. This pattern signifies a shift in market sentiment from bullish to bearish, indicating that buyers are losing control, and a potential downtrend might be on the horizon.

The psychology behind the double top pattern is crucial for understanding its significance. During the formation of the first peak, the market is still driven by bullish sentiment, pushing the price higher. However, as the price approaches the first peak, some traders start taking profits, causing a minor retracement. The second peak is formed when another bullish attempt occurs, but this time, the buying momentum weakens, and the price fails to break above the previous peak. This failure to make a new high demonstrates the waning strength of the bulls and can signal an impending reversal.
Key Components of the Double Top Pattern
1. First Peak: The initial peak marks the end of the uptrend. It's a point where the bullish momentum starts to stall, and profit-taking becomes more prevalent.
2. Trough: Following the first peak, there is usually a retracement or a minor dip in price as traders book profits. This trough acts as a support level.
3. Second Peak: The second attempt to push the price higher forms the second peak. However, it fails to surpass the level of the first peak, indicating a weakening bullish trend.
4. Neckline: The neckline is a horizontal line drawn through the trough between the two peaks. This line serves as a critical level of support. A decisive break below the neckline confirms the double top pattern and suggests a bearish reversal is underway.
Trading Strategies with the Double Top Pattern
Trading with the double top pattern requires a combination of technical analysis, risk management, and patience. Here are some effective strategies to consider:
1. Confirmation is Key: Patience is essential when trading the double top pattern. While spotting the pattern early is advantageous, traders often wait for a confirmation of the reversal before entering a trade. This confirmation usually comes with the break below the neckline. Waiting for the price to convincingly close below the neckline helps avoid false signals and ensures a more accurate entry point.
2. Measuring Price Targets: One way to estimate the potential price decline after the double top pattern completes is to measure the vertical distance from the neckline to the highest point of the two peaks. This distance is then projected downwards from the point of the neckline break. Traders should note that while this method provides a rough estimate, other factors like support levels and market sentiment can influence the actual price movement.
3. Volume Analysis: Volume can play a crucial role in confirming the validity of the double top pattern. Generally, the volume tends to decrease as the pattern forms. An increase in volume during the breakdown of the neckline can provide further confirmation of the impending reversal.
4. Risk Management: As with any trading strategy, risk management is paramount. Traders should set stop-loss orders above the second peak, reducing the potential loss if the trade goes against them. Additionally, position sizing should be based on the trader's risk tolerance and overall portfolio strategy.
5. Combining with Other Indicators: The double top pattern can be more potent when combined with other technical indicators. For instance, if the pattern coincides with overbought conditions on the Relative Strength Index (RSI) or a bearish crossover on moving averages, the likelihood of a successful trade increases.
6. Timeframes Matter: The effectiveness of the double top pattern can vary across different timeframes. While it can work well on shorter timeframes, it's often more reliable on higher timeframes like the daily or weekly charts. This helps filter out market noise and provides a clearer picture of the overall trend.
7. Practice and Back-testing: Like any trading strategy, practicing the identification of double top patterns and back-testing its effectiveness on historical data is crucial. This helps traders develop an intuitive sense of the pattern and its nuances.
Footnote
The double top pattern is a powerful tool in a forex trader's arsenal, offering insights into potential trend reversals. Its simplicity and reliability make it a favorite among traders of all levels. However, traders must remember that no strategy is foolproof, and risk management remains paramount. The double top pattern should be used in conjunction with other technical analysis tools and should ideally align with the trader's broader market outlook. With patience, discipline, and a solid understanding of the pattern's dynamics, traders can enhance their trading decisions and increase their chances of success in the forex market.


Discussion