

Forex Trading Strategies for Using the Double Bottom Pattern: Approaches for Trading with the Double Bottom Chart Pattern
Forex trading is a dynamic and complex market that requires traders to utilize a wide range of tools and strategies to make informed decisions. One such tool in a trader's arsenal is chart patterns, which can offer valuable insights into potential price movements. Among these patterns, the Double Bottom pattern stands out as a reliable indicator of trend reversal, offering traders opportunities to enter the market at advantageous levels. In this article, we will delve into the intricacies of the Double Bottom pattern and explore effective trading strategies to capitalize on its potential.
Table Content
I. Understanding the Double Bottom Pattern
II. Trading Strategies for the Double Bottom Pattern
1. Confirmation is Key
2. Measuring Price Targets
3. Volume Analysis
4. Multiple Timeframe Analysis
5. Risk Management and Stop Loss
6. Patience and Discipline
III. Real-World Example: Trading the Double Bottom
1. Identifying the Pattern
2. Confirmation
3. Measuring Price Targets
4. Volume Analysis
5. Stop Loss and Risk Management
6. Patience and Discipline
IV. Footnote
Understanding the Double Bottom Pattern
The Double Bottom pattern is a bullish reversal pattern that appears on price charts after a downtrend. It signifies a shift from a bearish sentiment to a bullish one, indicating that the price might be gearing up for an upward movement. This pattern is characterized by two distinct lows at approximately the same price level, separated by a temporary high in between. Visually, it resembles the letter "W," with the two lows forming the two troughs of the letter.
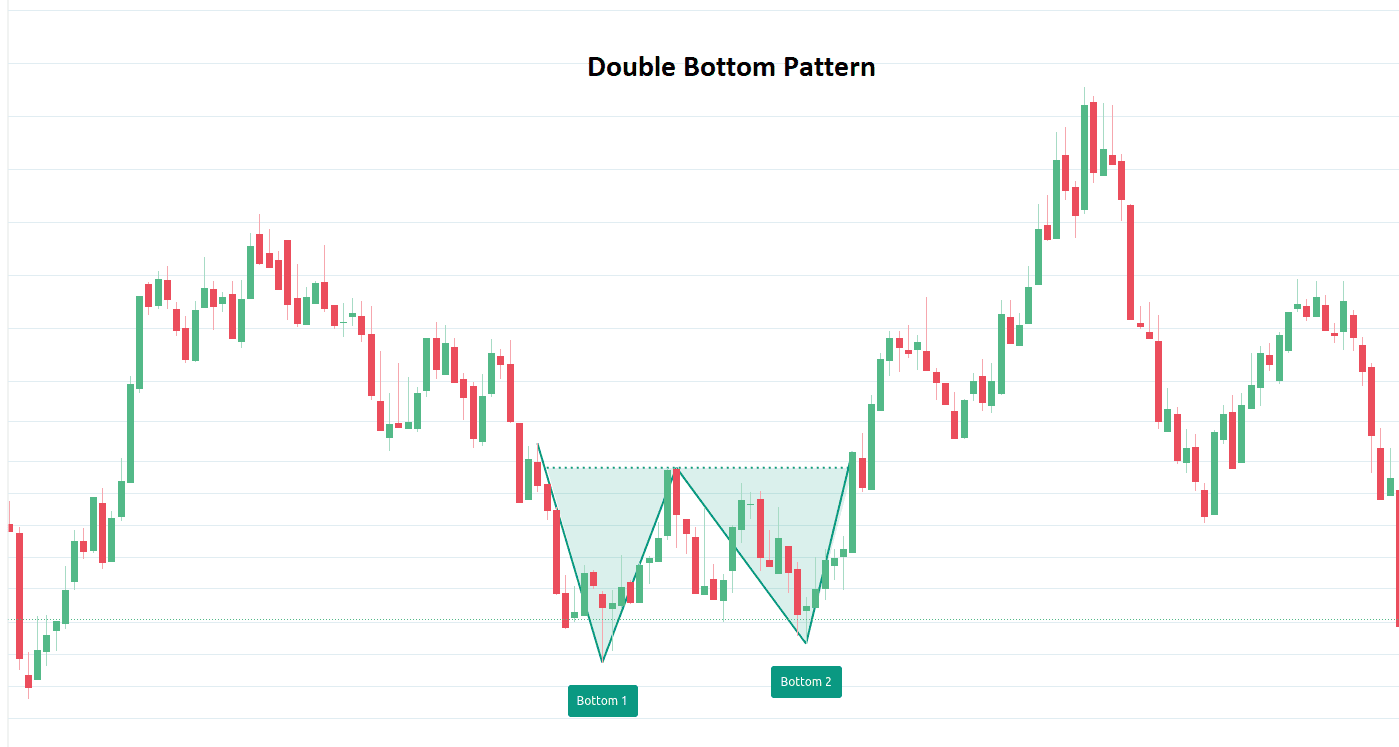
The psychology behind the Double Bottom pattern is rooted in market dynamics. During the formation of this pattern, the price reaches a certain level, bounces off, and then retraces to the same level again before finally making a bullish move. This indicates that the support level is strong, and the selling pressure that was driving the downtrend is waning. As the price fails to break below this level twice, traders start seeing it as a potential turning point, and a bullish sentiment starts to build.
Trading Strategies for the Double Bottom Pattern
Trading the Double Bottom pattern requires a combination of technical analysis, risk management, and patience. Here are several approaches that traders can consider when incorporating this pattern into their forex trading strategies:
1. Confirmation is Key
Before entering a trade based on the Double Bottom pattern, it's crucial to wait for confirmation. This means waiting for the price to break above the temporary high that forms between the two lows. This breakout serves as an indication that the bullish momentum is gaining strength and that the pattern is indeed signaling a trend reversal. Traders often use additional tools like moving averages or oscillators to confirm the breakout and ensure that the trend reversal is supported by other technical factors.
2. Measuring Price Targets
To estimate the potential price movement following the confirmation of the Double Bottom pattern, traders often use a simple measurement technique. The distance between the lowest low (the trough of the pattern) and the temporary high (the peak between the two lows) is measured and then added to the breakout level. This projection provides an approximate target for the bullish move. However, it's important to note that markets can be unpredictable, and the price may not always reach the projected target.
3. Volume Analysis
Volume can play a significant role in validating the Double Bottom pattern. Typically, during the formation of the pattern, there is a decrease in selling volume as the price approaches the second low. Once the pattern completes and the price starts to reverse, an increase in buying volume can provide additional confirmation of the trend reversal. Traders often look for volume spikes when the breakout occurs, as this indicates strong interest and participation from buyers.
4. Multiple Timeframe Analysis
To enhance the reliability of the Double Bottom pattern, traders can conduct multiple timeframe analysis. This involves examining the pattern on different timeframes to ensure that the bullish reversal is consistent across various scales. For instance, if the pattern appears on both the daily and weekly charts, it adds more weight to the potential trend reversal.
5. Risk Management and Stop Loss
As with any trading strategy, risk management is crucial when trading the Double Bottom pattern. Placing a stop-loss order below the second low of the pattern helps mitigate potential losses if the pattern fails to result in a bullish reversal. Additionally, traders should calculate their position size based on their risk tolerance and the distance between the entry point and the stop-loss level.
6. Patience and Discipline
Trading the Double Bottom pattern requires patience and discipline. Not every pattern will lead to a successful trade, and false breakouts can occur. It's essential to wait for confirmation and not jump into a trade prematurely. Additionally, sticking to your trading plan and not letting emotions drive your decisions is vital for consistent success.
Real-World Example: Trading the Double Bottom
Let's consider a hypothetical real-world example of how a trader might apply the Double Bottom pattern in their forex trading strategy:
1. Identifying the Pattern: The trader notices a Double Bottom pattern forming on the USD/EUR currency pair after a prolonged downtrend. The two lows are at 1.1000, and the temporary high is at 1.1200.
2. Confirmation: The trader waits for the price to break above the temporary high at 1.1200. Once this breakout occurs, they receive confirmation that a potential bullish reversal is underway.
3. Measuring Price Targets: The distance between the lowest low (1.1000) and the temporary high (1.1200) is 200 pips. The trader adds this distance to the breakout level (1.1200), setting a target of approximately 1.1400.
4. Volume Analysis: The breakout is accompanied by a significant increase in buying volume, confirming the strength of the bullish sentiment.
5. Stop Loss and Risk Management: The trader places a stop-loss order below the second low at 1.1000 to protect against potential losses. They ensure that their position size is appropriate based on their risk tolerance.
6. Patience and Discipline: The trader remains patient, allowing the trade to unfold according to the plan. They avoid making impulsive decisions based on short-term market fluctuations.
Footnote
The Double Bottom pattern is a powerful tool in a forex trader's toolkit, offering insights into potential bullish reversals after downtrends. By combining technical analysis with risk management and patience, traders can develop effective strategies to capitalize on the pattern's potential. Remember that no trading strategy guarantees success, and it's essential to continuously educate yourself, practice in a risk-controlled environment, and adapt your approach as market conditions evolve. Whether you're a novice or experienced trader, the Double Bottom pattern can provide valuable opportunities for profitable trades in the dynamic world of forex trading.


Discussion