
Forex Trading Strategies for Using the Doji Pattern: Approaches for Trading with Doji Candlestick Patterns
In the world of forex trading, candlestick patterns have long been a reliable tool for technical analysis. Among these patterns, the Doji candlestick holds a special place due to its unique characteristics and the insights it can provide to traders. A Doji occurs when the opening and closing prices of an asset are virtually the same, creating a small-bodied candle with an almost horizontal line. Despite its simple appearance, the Doji pattern can convey valuable information about market sentiment and potential trend reversals. In this article, we will explore various forex trading strategies for effectively utilizing the Doji pattern to enhance trading decisions.
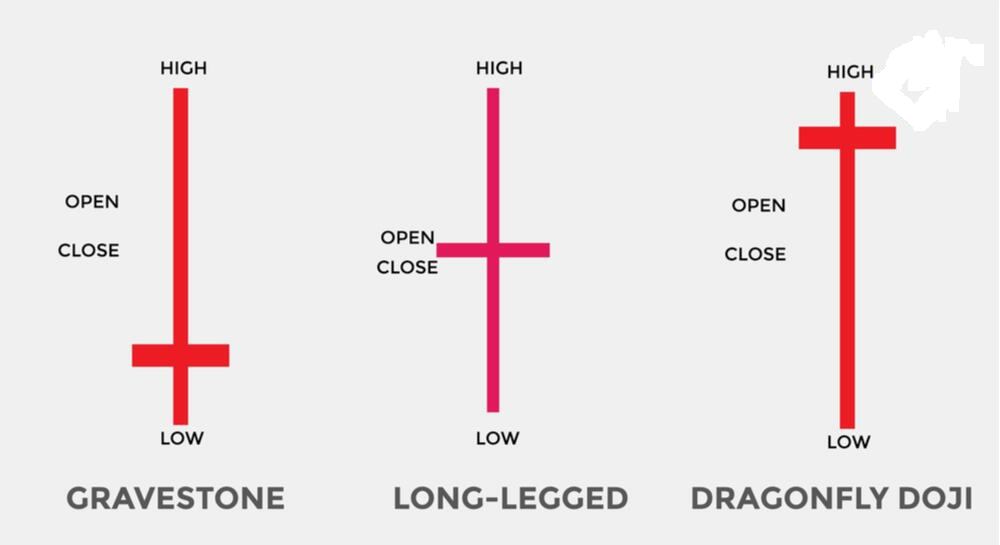
Table Content
I. Understanding the Doji Pattern
1. Classic Doji
2. Long-Legged Doji
3. Dragonfly Doji
4. Gravestone Doji
II. Trading Strategies with Doji Patterns
1. Doji as a Reversal Signal
2. Combining Doji with Other Indicators
3. Doji in Range-Bound Markets
4. Volatility Breakout with Long-Legged Doji
5. Dragonfly and Gravestone Doji as Entry Signals
III. Risk Management
IV. Footnote
Understanding the Doji Pattern:
Before delving into trading strategies, it's essential to grasp the different types of Doji patterns and their implications:
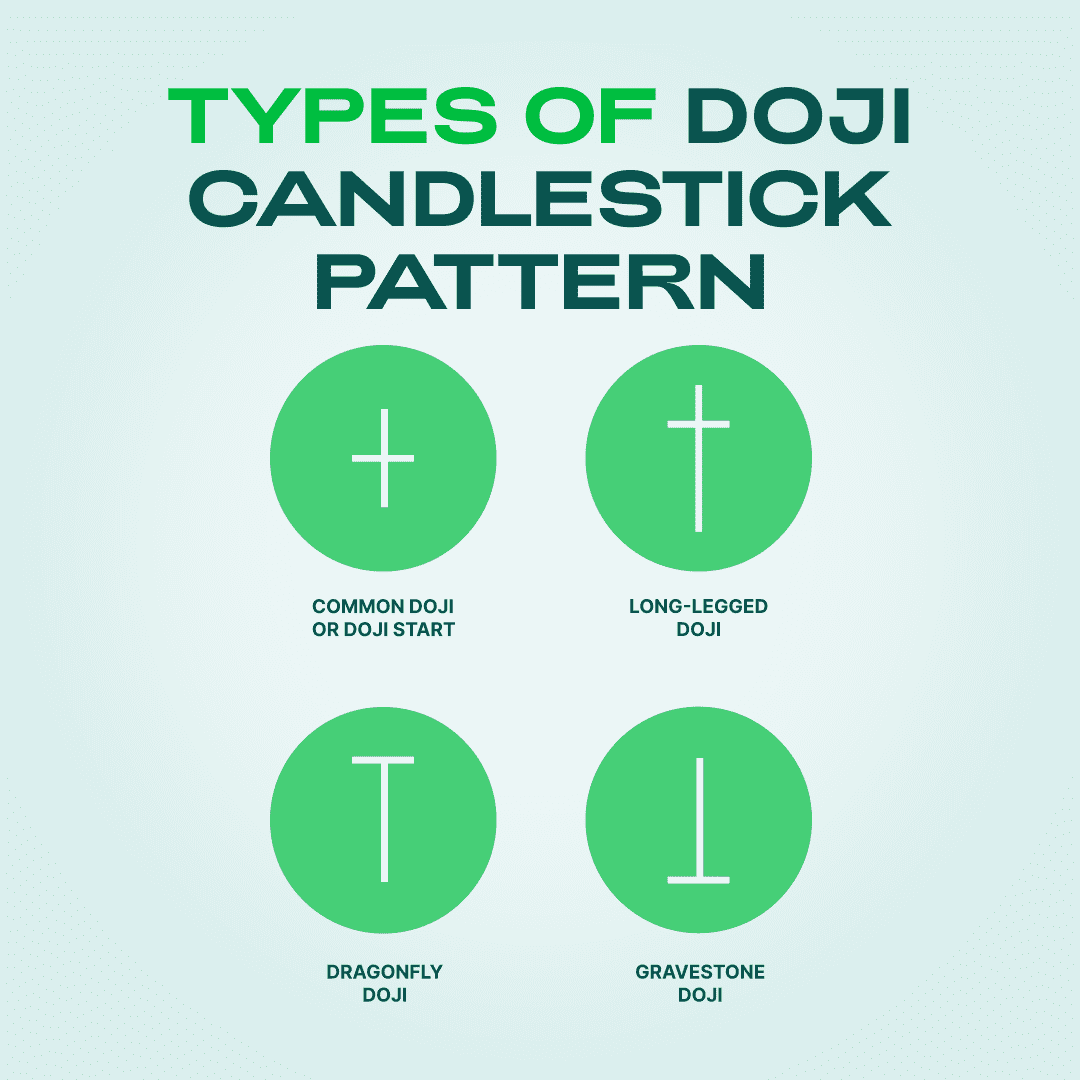
1. Classic Doji: Classic Daji or common doji is the most basic form of the pattern, where the open and close prices are identical or nearly identical. It suggests market indecision and potential trend reversal.
2. Long-Legged Doji: In this pattern, the upper and lower shadows (wicks) are significantly longer than the body. This indicates more pronounced uncertainty and potential volatility.
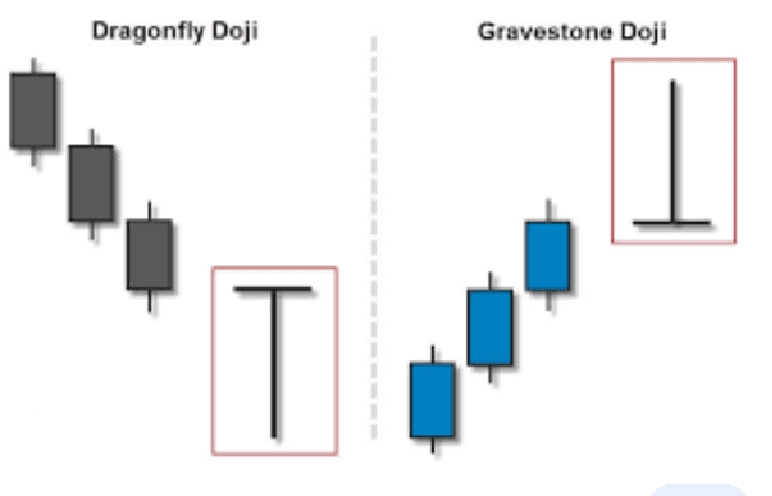
3. Dragonfly Doji: Characterized by a small or non-existent upper shadow and a long lower shadow, this pattern signals that sellers dominated the market initially, but then the buyers pushed the price back up.
4. Gravestone Doji: The opposite of the Dragonfly Doji, the Gravestone Doji has a long upper shadow and little to no lower shadow, indicating an initial push by buyers followed by a reversal driven by sellers.
Each Doji pattern has distinct implications and can provide insights into potential price reversals or trend continuation. Effective use of these patterns requires an understanding of market context and the confirmation of other technical indicators.
Trading Strategies with Doji Patterns:
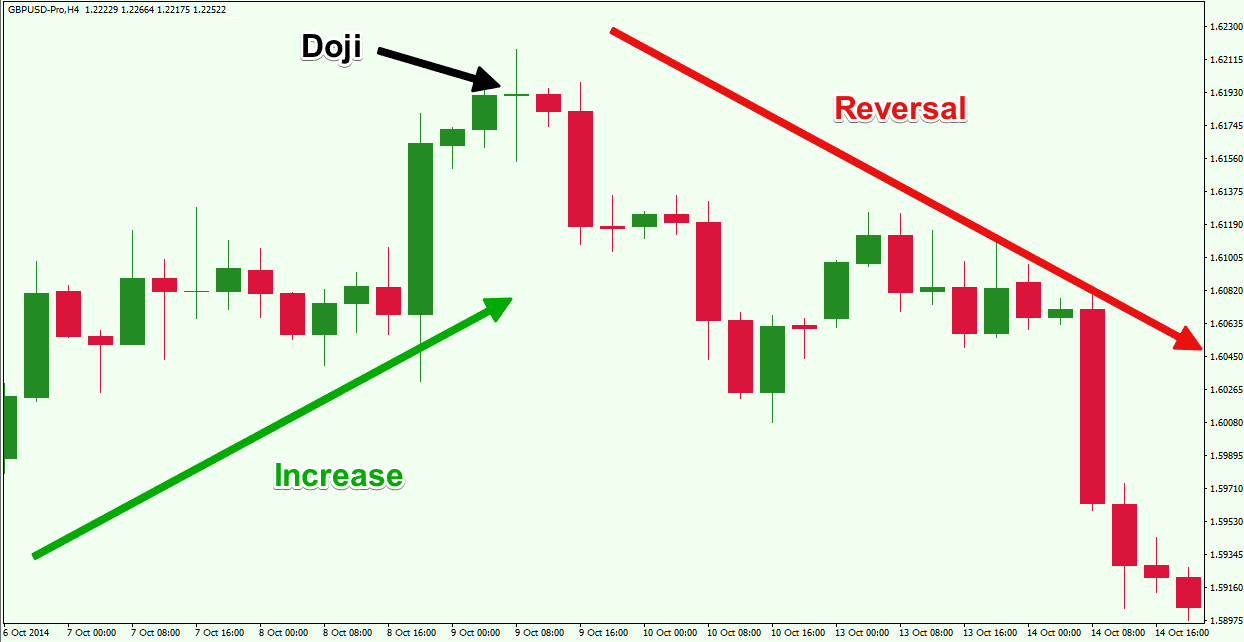
1. Doji as a Reversal Signal: One of the primary uses of the Doji pattern is to signal potential trend reversals. A classic Doji, appearing after a prolonged uptrend or downtrend, can suggest that market sentiment is shifting. To confirm a reversal, traders often look for additional signals such as trendlines, support and resistance levels, or other candlestick patterns.
Strategy:
a) Identify a prolonged uptrend or downtrend.
b) Wait for a Doji to form.
c) Look for confirmation through the breach of trendlines or key support/resistance levels.
d) Place a trade in the direction of the anticipated reversal.
2. Combining Doji with Other Indicators: To enhance the reliability of Doji patterns, traders often use them in conjunction with other technical indicators. For instance, pairing a Doji with indicators like Relative Strength Index (RSI) or Moving Average Convergence Divergence (MACD) can provide additional confirmation of a potential reversal.
Strategy:
a) Identify a Doji pattern.
b) Check for overbought or oversold conditions using RSI.
c) Look for MACD crossovers or divergences.
d) If these indicators align with the Doji signal, consider entering a trade.
3. Doji in Range-Bound Markets: Doji patterns can be particularly useful in range-bound markets where prices move within a specific range without establishing a clear trend. In such cases, Doji patterns occurring near support or resistance levels can signify potential turning points.
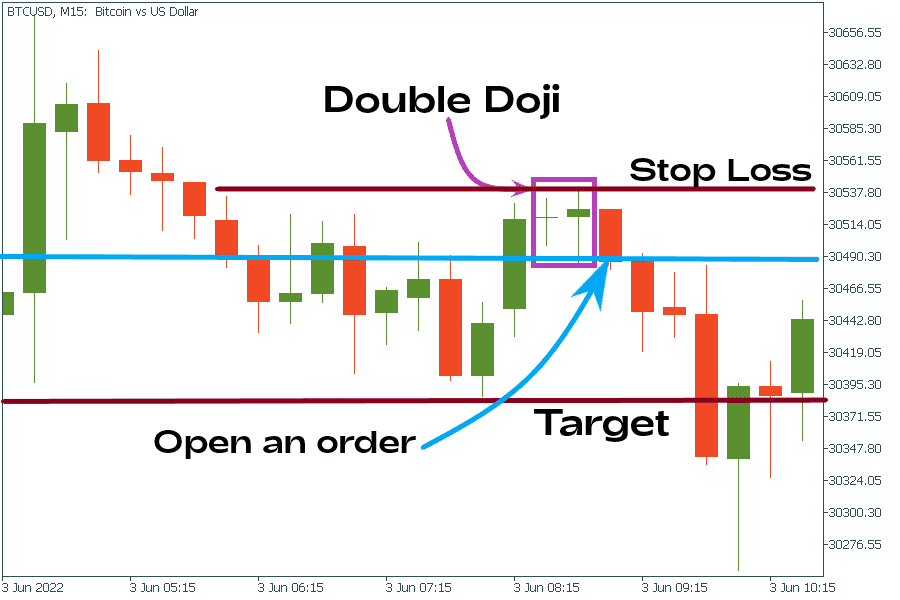
Strategy:
a) Identify a range-bound market with clear support and resistance levels.
b) Wait for a Doji to form near these levels.
c) Consider a long trade if the Doji forms near support or a short trade if it forms near resistance.
d) Place stop-loss orders to manage risk.
4. Volatility Breakout with Long-Legged Doji: Long-Legged Doji patterns with their extended wicks indicate increased market uncertainty and potential volatility. Traders can utilize this volatility to their advantage by trading breakouts when prices move beyond the range defined by the Doji's high and low points.
Strategy:
a) Identify a Long-Legged Doji pattern.
b) Mark the high and low points of the Doji.
c) Place pending orders slightly above the high and below the low.
d) When price breaks out in either direction, enter a trade in that direction.
5. Dragonfly and Gravestone Doji as Entry Signals: Dragonfly and Gravestone Doji patterns can act as potent entry signals when combined with other confirming factors. For instance, a Dragonfly Doji forming at a key support level can be a strong signal to enter a long trade, while a Gravestone Doji near resistance can indicate a potential short trade opportunity.
Strategy:
a) Identify a Dragonfly or Gravestone Doji near a support or resistance level.
b) Confirm the pattern with additional indicators or price action signals.
c) Enter a trade in the direction indicated by the Doji pattern.
Risk Management:
While the Doji pattern can provide valuable insights into potential price reversals and entry points, successful forex trading requires a comprehensive risk management strategy. It's crucial to manage position sizes, set stop-loss orders, and consider the overall market context before executing trades based solely on candlestick patterns. Moreover, incorporating fundamental analysis and staying updated on economic events can further refine trading decisions.
Footnote:
In summary, the Doji pattern is a powerful tool in a forex trader's arsenal, offering insights into market sentiment and potential trend reversals. By understanding the different types of Doji patterns and integrating them with other technical indicators, traders can enhance their ability to make informed trading decisions. However, it's essential to remember that no strategy is foolproof, and risk management remains paramount in the pursuit of successful trading outcomes.


Discussion