
Forex Trading Strategies for Using the Descending Triangle Pattern: Techniques for Trading with the Descending Triangle Chart Pattern
In the world of forex trading, success is often driven by a trader's ability to identify and effectively utilize various chart patterns. The descending triangle pattern is one such formation that can provide valuable insights into potential price movements. This pattern is characterized by a series of lower highs converging with a horizontal support level, creating a triangle-like shape that points downward. Traders who understand how to interpret and capitalize on the descending triangle pattern can enhance their trading strategies and make more informed decisions.
Table Content
I. Understanding the Descending Triangle Pattern
II. Key Components of the Descending Triangle Pattern
1. Lower Highs
2. Horizontal Support
3. Converging Trendlines
III. Trading Techniques for Descending Triangle Patterns
1. Identify Valid Patterns
2. Wait for Confirmation
3. Use Volume Analysis
4. Set Stop Loss and Take Profit Levels
5. Consider Multiple Timeframes
6. Be Prepared for False Breakouts
IV. Footnote
Understanding the Descending Triangle Pattern
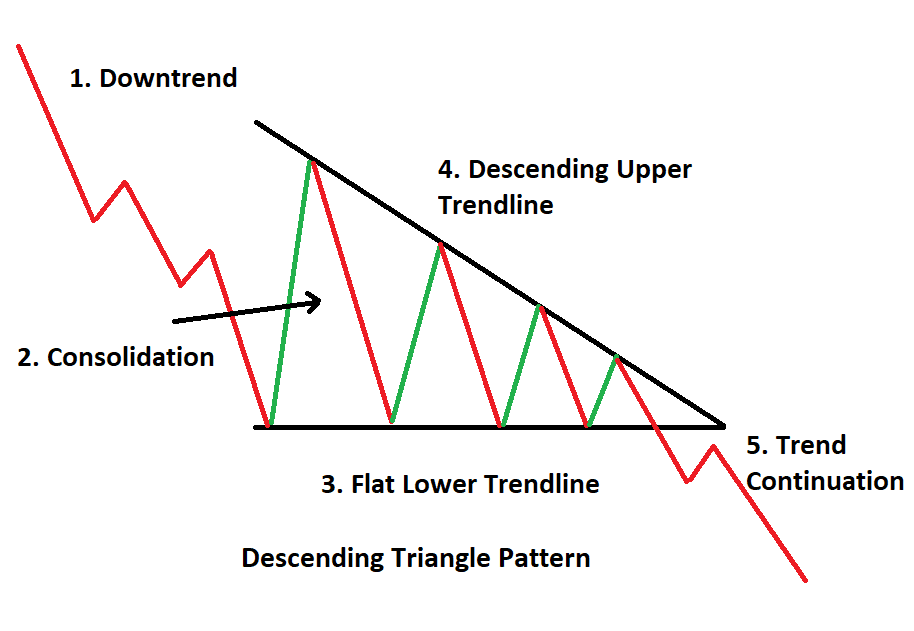
The descending triangle pattern is a bearish continuation pattern, which means that it usually forms during a downtrend and signals the likelihood of further downward movement. This pattern typically reflects a period of consolidation after a significant price decline, as sellers take a breather before resuming their push. The pattern is formed by drawing a horizontal trendline connecting the lows and a descending trendline connecting the lower highs. As these lines converge, they create a triangle, with the lower highs indicating selling pressure and the horizontal support representing a potential level where buyers might step in.
Key Components of the Descending Triangle Pattern:
1. Lower Highs: One of the essential components of the descending triangle pattern is the series of lower highs. These highs signal that, despite temporary price recoveries, sellers are consistently able to push the price lower. This decline in upward momentum can signify weakening buyer interest and increasing seller dominance.
2. Horizontal Support: The horizontal support level acts as a barrier to further downward movement. This level is formed by connecting the lows of the price action within the pattern. It represents an area where buyers might see an opportunity to enter the market, potentially causing a reversal or a bounce in the price.
3. Converging Trendlines: The descending triangle pattern is visually characterized by the convergence of the lower highs trendline and the horizontal support level. This convergence forms the triangle shape that gives the pattern its name. The decreasing space between these two trendlines suggests that the range of price movement is tightening, often leading to a breakout.
Trading Techniques for Descending Triangle Patterns:
1. Identify Valid Patterns: Not every triangle-like formation is a valid descending triangle pattern. Traders must ensure that the lower highs trendline and the horizontal support are clearly defined and have at least two touches each. This helps confirm the validity of the pattern and increases the likelihood of accurate predictions.
2. Wait for Confirmation: As with any trading strategy, confirmation is crucial. Traders should wait for a clear breakout to occur before entering a trade. A breakout happens when the price closes decisively below the horizontal support level. This event signals that the sellers have gained the upper hand and that further downward movement is likely.
3. Use Volume Analysis: Volume can play a significant role in validating the breakout of a descending triangle pattern. A breakout accompanied by a surge in volume indicates strong market participation, increasing the credibility of the pattern's signal. Traders should watch for increased volume during the breakout to confirm the potential for a strong trend continuation.
4. Set Stop Loss and Take Profit Levels: Proper risk management is essential in forex trading. Traders should set a stop-loss order above the descending trendline or the horizontal support level to limit potential losses if the trade goes against them. Take profit levels can be set by measuring the height of the triangle pattern and projecting it downward from the breakout point. This provides an estimate of the potential price target.
5. Consider Multiple Timeframes: Analyzing the descending triangle pattern across different timeframes can provide a more comprehensive view of the pattern's strength. A descending triangle pattern that is evident on multiple timeframes is likely to have a more significant impact on price movement.
6. Be Prepared for False Breakouts: False breakouts, where the price briefly moves beyond the pattern's boundaries but then reverses, are a common occurrence. Traders should be cautious and wait for a confirmed breakout before entering a trade. Using additional technical indicators, such as the Relative Strength Index (RSI) or Moving Averages, can help filter out false signals.
Footnote:
The descending triangle pattern is a powerful tool in a forex trader's arsenal for predicting and capitalizing on potential price movements. By understanding the components of this pattern and employing effective trading techniques, traders can enhance their ability to identify reliable entry and exit points. It's essential to remember that while the descending triangle pattern provides valuable insights, no strategy is foolproof. Traders should always exercise proper risk management and combine the pattern's signals with other technical and fundamental analyses for a well-rounded trading approach. As with any trading strategy, continuous learning and adaptation are key to success in the dynamic world of forex trading.


Discussion