
Forex trading strategies for using the CCI indicator: Techniques for trading with the Commodity Channel Index.
In the dynamic world of forex trading, traders are constantly seeking tools and indicators that can help them make informed decisions and increase their chances of success. One such tool that has gained popularity among traders is the Commodity Channel Index (CCI). The CCI indicator is a versatile tool that can provide valuable insights into market trends, momentum, and potential reversal points. In this article, we will delve into various forex trading strategies that utilize the CCI indicator to enhance trading outcomes.
Table Content
I. Understanding the Commodity Channel Index (CCI) Indicator
II. Trading Strategies Utilizing the CCI Indicator
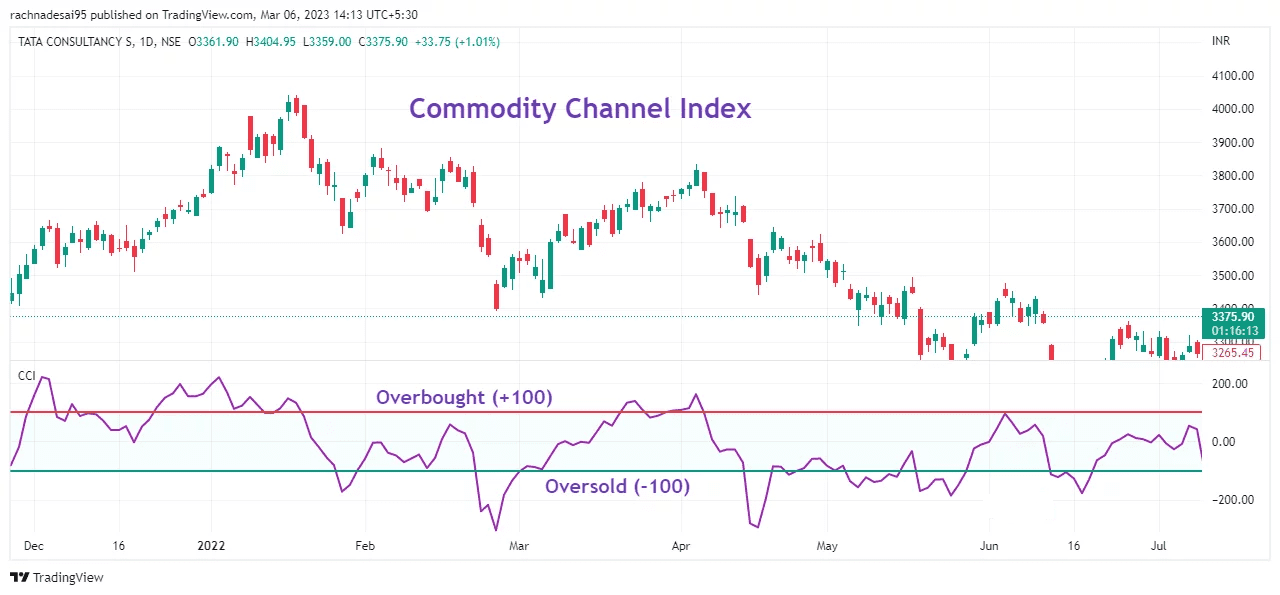
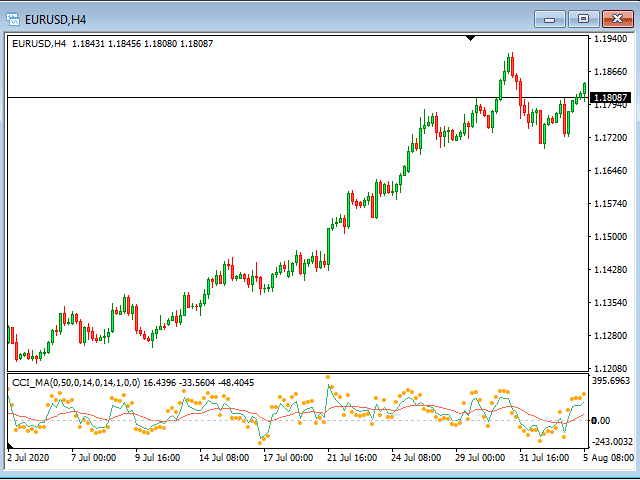
1. CCI as an Overbought and Oversold Indicator
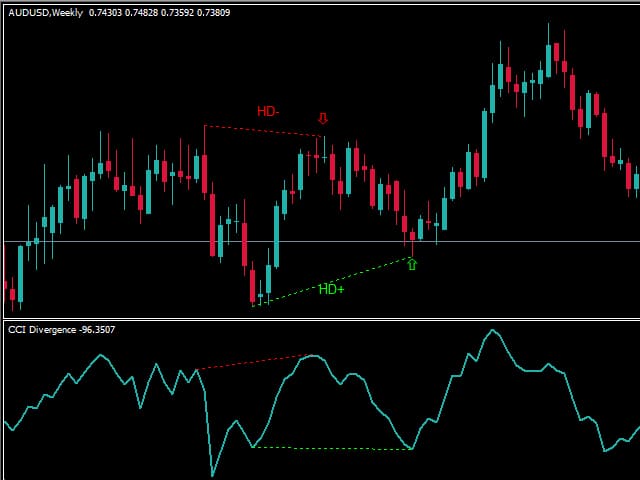
2. CCI Divergence
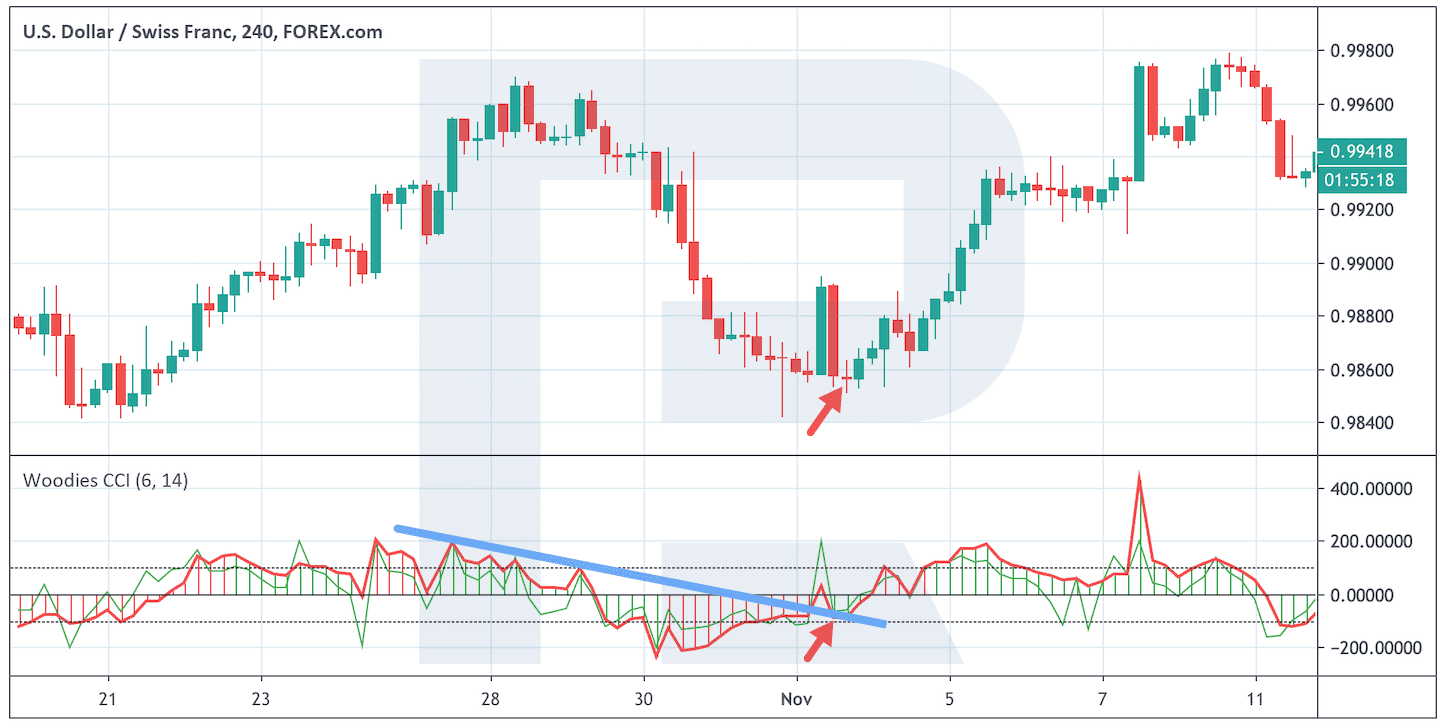
3. CCI with Trendlines
4. CCI and Moving Averages
5. CCI and Support/Resistance
6. CCI and Price Patterns
7. Multiple Timeframe Analysis
III. Risk Management and Considerations
1. Confirmation from Other Indicators
2. Risk-Reward Ratio
3. Demo Trading
4. Market Conditions
IV. Footnote
Understanding the Commodity Channel Index (CCI) Indicator
Developed by Donald Lambert in the 1980s, the Commodity Channel Index (CCI) is an oscillator-type indicator that is widely used in various financial markets, including forex. The CCI indicator is designed to identify overbought and oversold levels, as well as potential trend reversals.
The CCI indicator measures the difference between the current price and its simple moving average (SMA), relative to its mean absolute deviation.
The formula is as follows:
CCI = (Typical Price - SMA) / (0.015 * Mean Deviation)
The result is a value that oscillates around zero. Positive values indicate that the price is above its average, while negative values suggest that the price is below its average. Extreme positive values can signal overbought conditions, whereas extreme negative values can signal oversold conditions.
Trading Strategies Utilizing the CCI Indicator
1. CCI as an Overbought and Oversold Indicator
One of the simplest ways to use the CCI indicator is to identify overbought and oversold conditions. Traders can consider selling when the CCI moves above +100, indicating an overbought market, and buying when the CCI drops below -100, suggesting an oversold market. However, it's important to note that in strongly trending markets, the CCI can remain in overbought or oversold territory for extended periods, so additional confirmation signals are advised.
2. CCI Divergence
Divergence occurs when the price moves in a direction opposite to the movement of an indicator. CCI divergence can signal potential reversals. For instance, if the price is making lower lows while the CCI is making higher lows, it could indicate that the downtrend is losing momentum and a reversal might be on the horizon. Traders often wait for confirmation from other technical indicators before acting on divergence signals.
3. CCI with Trendlines
Incorporating trendlines with the CCI indicator can provide a comprehensive view of potential price movements. When the CCI is moving in the same direction as the trendline, it can validate the prevailing trend. If the CCI crosses the trendline in the opposite direction, it could signal a possible reversal. This strategy helps traders enter trades in line with the broader trend while keeping an eye on potential turning points.
4. CCI and Moving Averages
Combining the CCI indicator with moving averages can offer a more refined approach to identifying trading opportunities. When the CCI crosses above a longer-term moving average, it might suggest a bullish trend, while a cross below a moving average could signal a bearish trend. The moving average acts as a filter to confirm the CCI's signals.
5. CCI and Support/Resistance
Support and resistance levels are crucial areas where price often experiences barriers. Integrating the CCI indicator with these levels can provide insights into potential breakouts or reversals. If the CCI crosses above resistance, it could indicate a potential breakout, while a cross below support might suggest a possible breakdown. Traders should confirm these signals with other indicators and price action patterns.
6. CCI and Price Patterns
Price patterns, such as head and shoulders, triangles, and flags, can offer valuable insights into future price movements. When the CCI confirms the formation of a price pattern, it can enhance the reliability of the pattern itself. For instance, if a bullish flag pattern forms and the CCI crosses above +100, it could signal a strong upward continuation.
7. Multiple Timeframe Analysis
Utilizing the CCI indicator across multiple timeframes can provide a broader perspective on market trends and potential entry points. Traders can use a higher timeframe to identify the overall trend and a lower timeframe to pinpoint entry and exit levels. When the CCI aligns with the trend on both timeframes, it can provide a higher probability trade setup.
Risk Management and Considerations
While the CCI indicator can be a valuable tool in a trader's toolkit, it's important to remember that no indicator is foolproof. False signals can occur, leading to losing trades. To mitigate risks and enhance the effectiveness of CCI-based strategies, traders should consider the following:
1. Confirmation from Other Indicators: It's advisable to use the CCI indicator in conjunction with other technical indicators, such as moving averages, trendlines, and volume indicators. Multiple confirmations increase the reliability of trade signals.
2. Risk-Reward Ratio: Implementing a favorable risk-reward ratio is crucial. Traders should define their stop-loss and take-profit levels before entering a trade to ensure that potential losses are manageable compared to potential gains.
3. Demo Trading: Before applying CCI-based strategies to live trading, practice on a demo account. This helps in understanding how the indicator behaves in different market conditions and refining trading strategies without risking real capital.
4. Market Conditions: Market conditions can change rapidly. Avoid relying solely on the CCI indicator during highly volatile periods or news events. Fundamental analysis and awareness of economic events are equally important.
5. Adaptability: Markets evolve, and strategies that work well in one market environment might not perform as effectively in another. Traders should continuously assess and adapt their strategies based on changing market dynamics.
Footnote
The Commodity Channel Index (CCI) is a versatile indicator that can provide valuable insights into forex market trends, momentum, and potential reversal points. While the indicator offers several trading strategies, successful trading requires a combination of technical analysis, risk management, and market awareness. Traders should develop a deep understanding of the CCI indicator, practice its application on demo accounts, and consider its signals in conjunction with other indicators and tools. By doing so, traders can harness the power of the CCI indicator to make informed trading decisions and increase their chances of success in the competitive world of forex trading.


Discussion