

Forex Trading Strategies for Using the ADX Indicator: Techniques for Trading with the Average Directional Index
The world of forex trading is a dynamic and intricate landscape where traders constantly seek effective tools and strategies to maximize their profits and minimize their risks. Among the multitude of technical indicators available to traders, the Average Directional Index (ADX) stands out as a powerful tool for assessing the strength of a trend. The ADX indicator, developed by J. Welles Wilder, is a versatile tool that can provide valuable insights into market trends, helping traders make more informed decisions. In this article, we will delve into the intricacies of the ADX indicator and explore various forex trading strategies that leverage its potential.
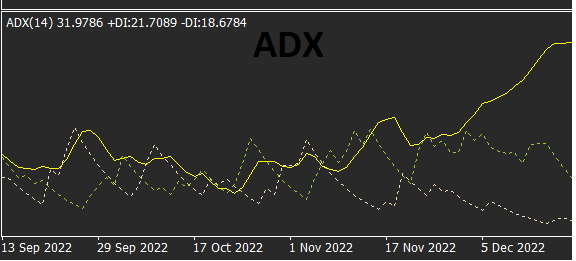
Table Content
I. Understanding the ADX Indicator
II. ADX Interpretation
III. Trading Strategies with the ADX Indicator
1. Trend Confirmation Strategy
2. ADX Breakout Strategy
3. ADX Crossover Strategy
4. ADX and Moving Averages Strategy
5. ADX Divergence Strategy
IV. Risk Management
V. Footnote
Understanding the ADX Indicator:
The Average Directional Index (ADX) is a technical indicator designed to measure the strength of a trend in the forex market. Unlike many other indicators, the ADX does not provide buy or sell signals; instead, it focuses on quantifying the strength of a trend regardless of its direction – whether it's an uptrend, downtrend, or sideways movement. The ADX value typically ranges from 0 to 100, with higher values indicating a stronger trend.
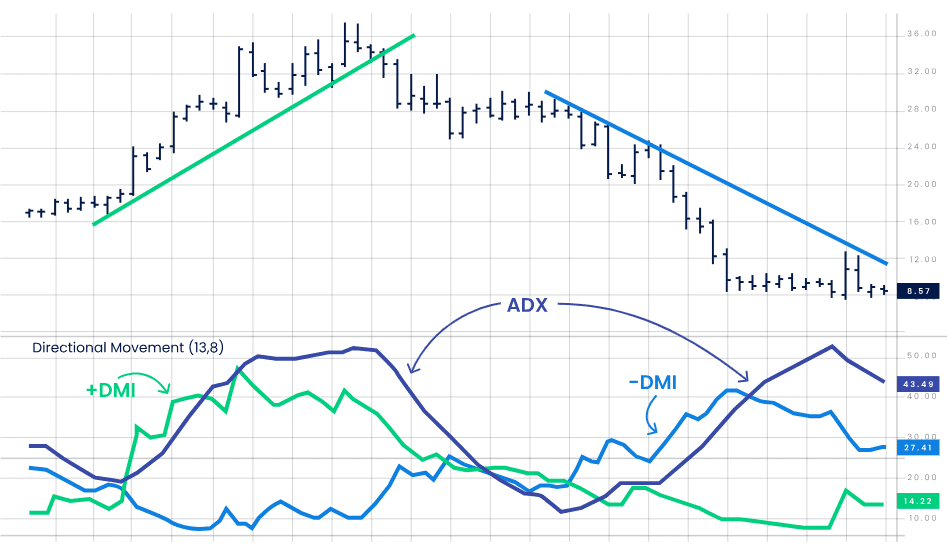
The ADX is composed of three lines: the ADX line itself, along with two additional lines called the Positive Directional Index (+DI) and the Negative Directional Index (-DI). The +DI measures the strength of upward movement, while the -DI measures the strength of downward movement. The ADX line represents the strength of the overall trend.
ADX Interpretation:
Understanding how to interpret the ADX values is crucial for devising effective trading strategies. When the ADX value is below 20, it suggests a weak trend or a market that is ranging, indicating potential consolidation. In this situation, traders might consider staying on the sidelines until a clearer trend emerges.
When the ADX value is between 20 and 40, it signifies a strengthening trend. Traders can consider taking positions in the direction of the trend, looking for opportunities to ride the momentum.
ADX values between 40 and 60 are indicative of a strong trend. Traders can consider adding to their positions or holding onto their existing trades to maximize potential profits.
When the ADX value exceeds 60, it may indicate an extremely strong trend, but it could also signal an overextended market. In such cases, traders need to exercise caution, as a trend reversal or a correction might be imminent.
Trading Strategies with the ADX Indicator:
1. Trend Confirmation Strategy: This strategy involves using the ADX indicator to confirm the strength of a trend identified through other means, such as trendlines or moving averages. When the ADX line crosses above 25, it can serve as confirmation that the trend is gaining momentum. Traders can then consider entering a trade in alignment with the direction of the trend.
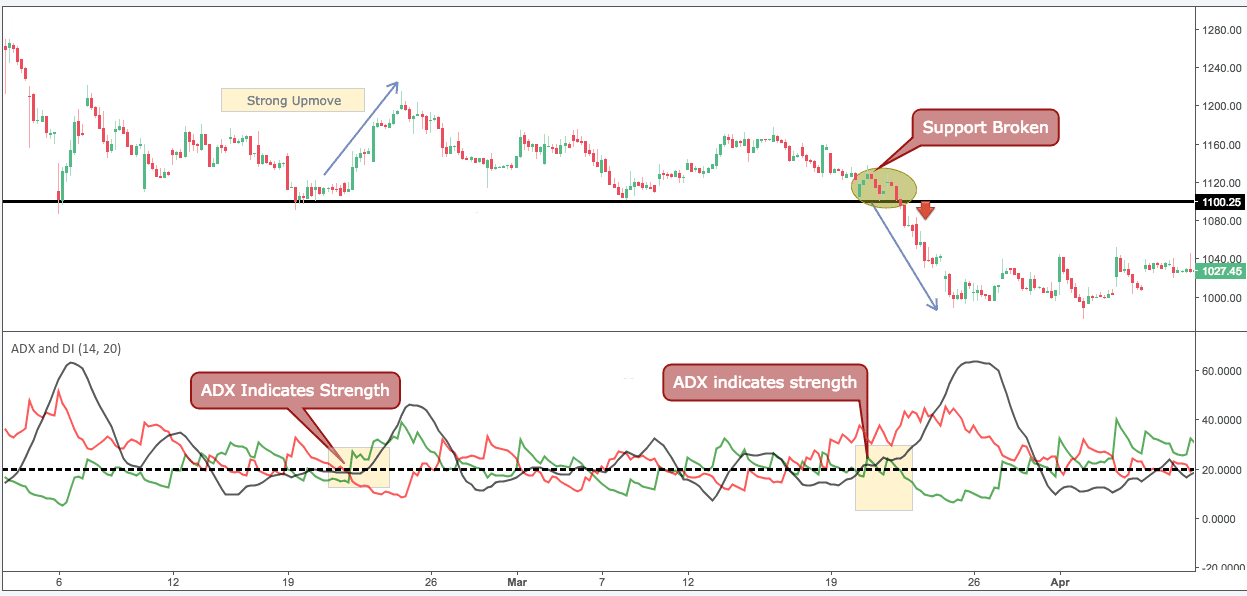
2. ADX Breakout Strategy: Traders can employ this strategy when the ADX value rises above 20. They can wait for a breakout above a key resistance level or below a support level. Once the breakout occurs and is confirmed by the ADX value, traders can initiate a trade in the direction of the breakout.
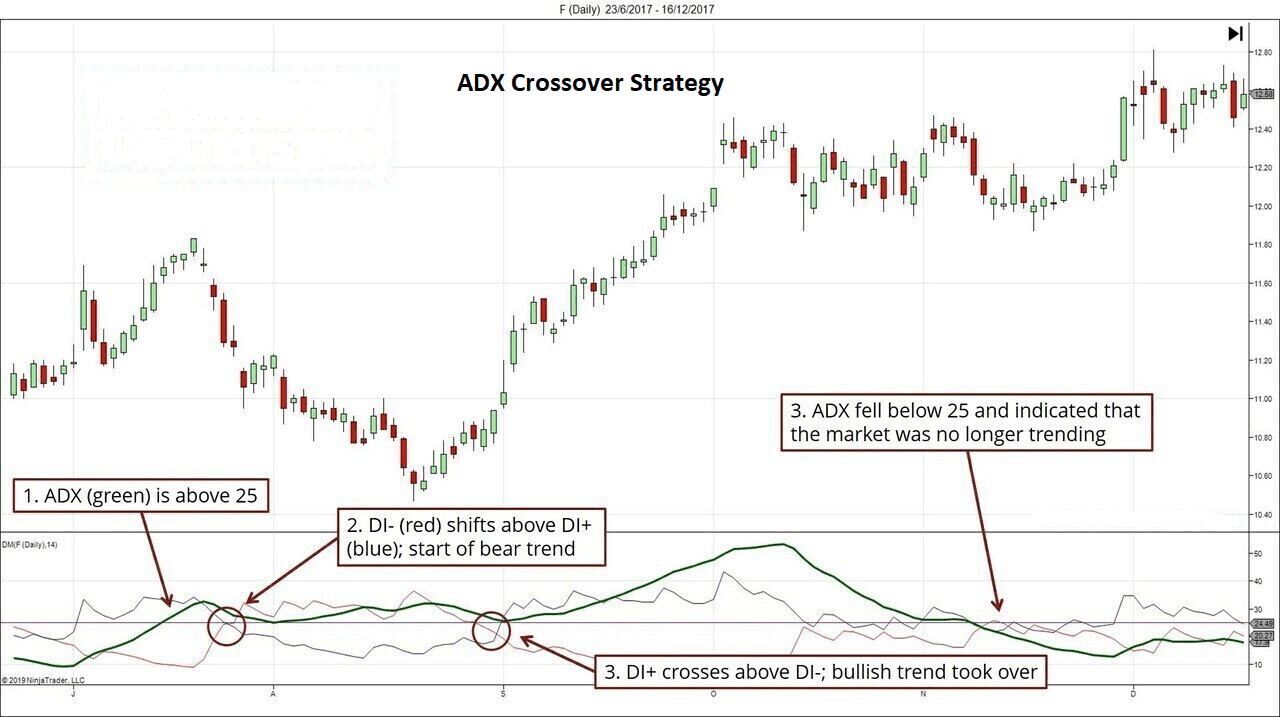
3. ADX Crossover Strategy: This strategy involves monitoring the crossovers between the +DI and -DI lines. When the +DI crosses above the -DI, it indicates potential upward momentum, and vice versa. Traders can use these crossovers as signals to enter trades.
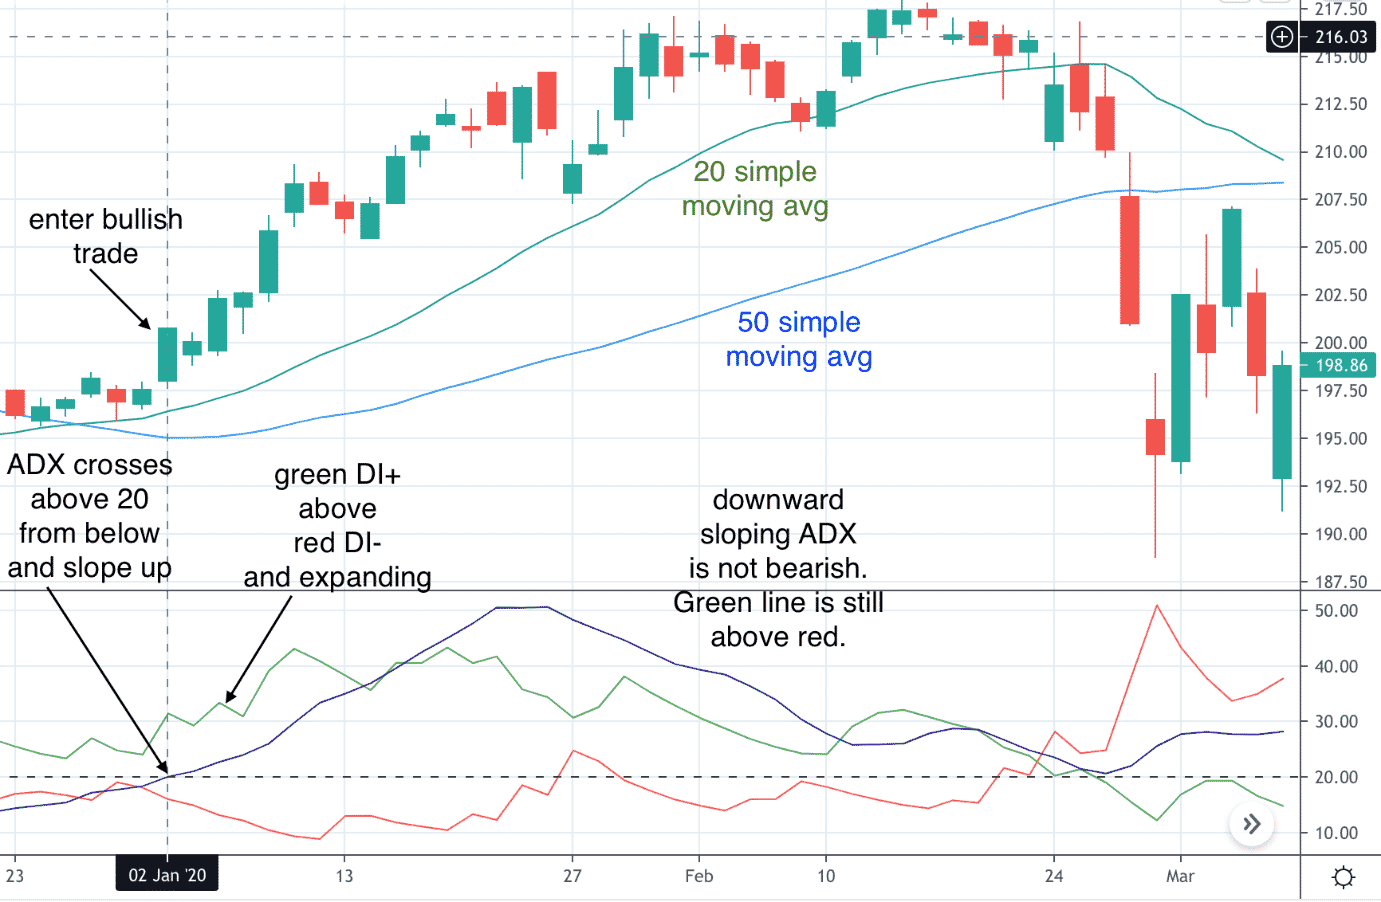
4. ADX and Moving Averages Strategy: By combining the ADX indicator with moving averages, traders can create a powerful strategy. When the ADX value is rising, indicating a strengthening trend, and the price is above a moving average, traders can look for opportunities to go long. Conversely, when the ADX value is rising, and the price is below a moving average, short positions might be considered.
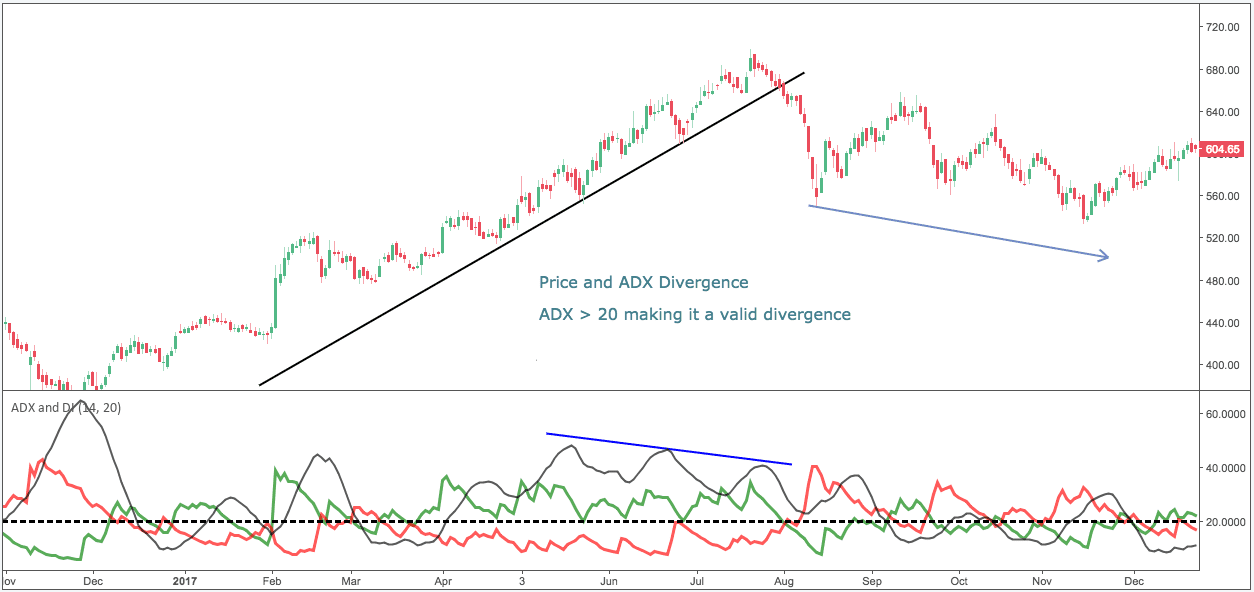
5. ADX Divergence Strategy: Divergence occurs when the price movement diverges from the movement of the ADX indicator. For instance, if the price is making lower lows while the ADX indicator is making higher highs, it could indicate a weakening trend. Traders can use this information to anticipate potential trend reversals.
Risk Management:
While the ADX indicator can provide valuable insights into market trends, it's important to remember that no single indicator guarantees success in forex trading. Effective risk management practices, such as setting stop-loss and take-profit orders, are essential to protect capital.
Footnote:
In summary, the Average Directional Index (ADX) is a versatile and powerful tool that can enhance a trader's ability to identify and capitalize on market trends. Its ability to measure the strength of a trend without bias toward its direction makes it a valuable addition to any forex trader's toolkit. However, like all trading tools, the ADX indicator is most effective when used in conjunction with other indicators and technical analysis methods. By employing the various trading strategies discussed in this article and adapting them to individual trading styles, traders can harness the potential of the ADX indicator to navigate the dynamic world of forex trading with greater confidence and precision.


Discussion