
Forex trading strategies for using price action with indicators: Approaches for combining price action and technical indicators.
The world of forex trading is both exciting and challenging, offering immense opportunities for profit alongside the potential risks. Among the various methodologies traders use to analyze and make informed decisions, the combination of price action and technical indicators has gained significant popularity. This strategic fusion aims to leverage the strengths of both approaches, enhancing the accuracy of trade entries and exits. In this article, we will delve into the realm of forex trading strategies that blend price action with technical indicators, exploring different approaches to effectively navigate the complex forex market.
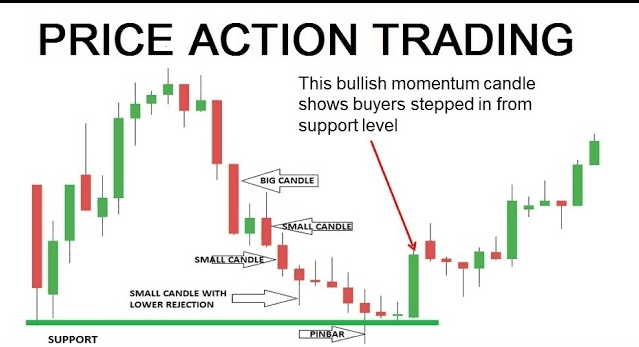
Table Content
I. Understanding Price Action and Technical Indicators
1. Price Action
2. Technical Indicators
II. The Power of Integration
1. Confluence of Signals
2. Trend Confirmation
3. Volatility and Momentum
4. Divergence and Reversals
III. Risk Management and Trade Execution
1. Position Sizing
2. Stop Loss and Take Profit
3. Back-testing
4. Demo Trading
5. Adaptation
IV. Implementing the Strategy
1. Study Your Chosen Indicators
2. Analyze Price Action
3. Look for Confluence
4. Plan Entry and Exit
5. Monitor and Adapt
V. FAQs: Answering Common Questions
VI. Footnote
Understanding Price Action and Technical Indicators
Before delving into the strategies themselves, let's take a moment to understand the two primary components we are integrating: price action and technical indicators.
1. Price Action: Price action analysis involves studying the movement of currency pairs based solely on their historical price data. This approach disregards external factors such as news events or economic indicators and focuses solely on how prices behave. Traders employing price action techniques scrutinize candlestick patterns, support and resistance levels, trend lines, and chart patterns to identify potential trading opportunities.
2. Technical Indicators: Technical indicators, on the other hand, are mathematical calculations derived from price and volume data. These tools provide additional insights into market trends, momentum, volatility, and other aspects that might not be readily apparent from price action alone. Examples of popular technical indicators include Moving Averages, Relative Strength Index (RSI), Stochastic Oscillator, and Bollinger Bands.
The Power of Integration
Combining price action with technical indicators creates a holistic approach to trading that can potentially offer more reliable signals and confirmations. While price action is adept at identifying support and resistance levels, as well as patterns like head and shoulders, triangles, and flags, technical indicators add quantitative measures that help confirm the validity of price action signals.
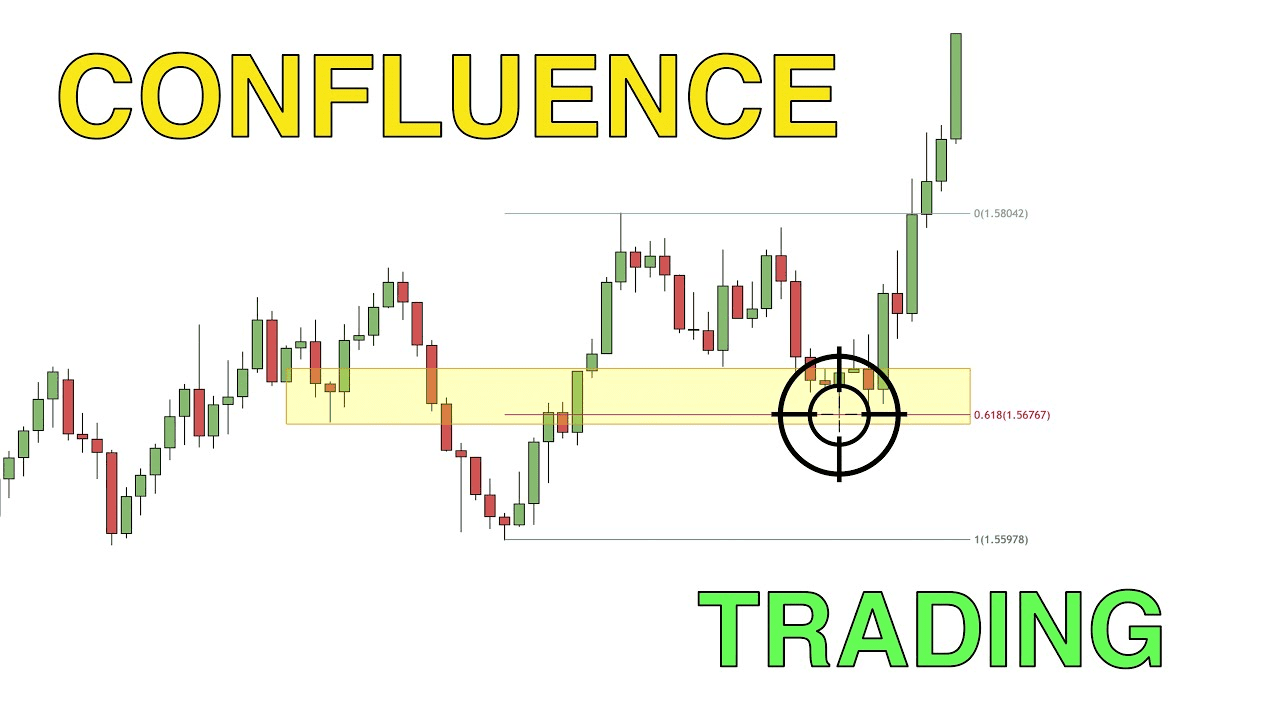
1: Confluence of Signals
One of the most straightforward methods of combining price action and technical indicators involves waiting for a confluence of signals. In this approach, a trader seeks alignment between price action patterns and the signals generated by technical indicators. For instance, if a price action pattern suggests a reversal at a certain support level, a confirmation from an oversold reading on the RSI or a bullish divergence on the MACD could enhance the confidence to take the trade.
2: Trend Confirmation
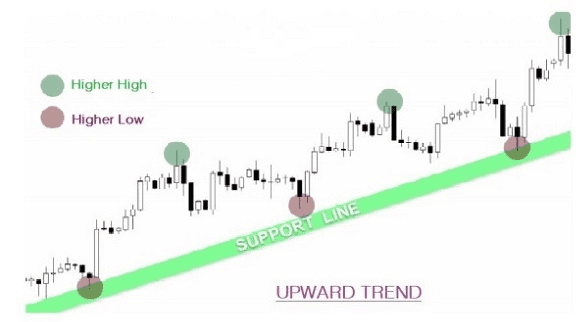
Price action can provide valuable insights into identifying trends. Combining this information with trend-following indicators can lead to more precise entries and exits. For instance, when price action shows a clear upward trend with higher highs and higher lows, using a Moving Average crossover strategy can be effective. When the price crosses above a long-term Moving Average while the short-term Moving Average crosses above the long-term one, it could be a signal to enter a long position, aligning with the overall trend.
3: Volatility and Momentum
Volatility is a crucial aspect of the forex market, and traders often use technical indicators to gauge it. Combining price action with volatility indicators like Bollinger Bands can help identify potential breakout opportunities. When the price consolidates within the bands and then breaks out with strong momentum, it could signal a potential trend continuation or reversal. This approach capitalizes on the synergy between price action patterns and technical measures of volatility and momentum.

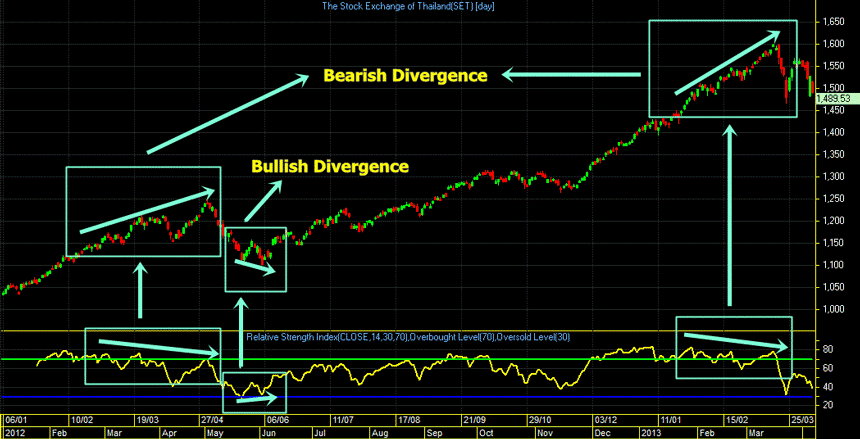
4: Divergence and Reversals
Divergence occurs when the price action and an indicator move in opposite directions, signaling a potential reversal. This is a powerful tool when combined with technical indicators like the RSI or the MACD. If the price is making lower lows while the indicator is making higher lows, it suggests weakening bearish momentum and a possible upward reversal. Divergence can provide traders with early signals of potential trend shifts and reversals, aiding in better market timing.
Risk Management and Trade Execution
While the integration of price action and technical indicators can enhance trading decisions, effective risk management and trade execution remain paramount. No strategy is foolproof, and losses are an inevitable part of trading. Here are some key considerations:
1) Position Sizing: Determine the appropriate position size for each trade based on your risk tolerance and overall trading capital. Avoid risking more than a certain percentage of your account on a single trade.
2) Stop Loss and Take Profit: Set stop-loss orders to limit potential losses and take-profit orders to secure profits. These orders should be based on the characteristics of the trade and the volatility of the currency pair.
3) Back-testing: Before applying any strategy in a live trading environment, conduct thorough back-testing on historical data. This helps you understand how the strategy would have performed in different market conditions.
4) Demo Trading: Practice the strategy in a demo account to gain experience and confidence before trading with real money.
5) Adaptation: Market conditions can change, rendering certain strategies less effective. Be prepared to adapt your approach and incorporate new indicators or techniques as needed.
Implementing the Strategy
Once you've chosen an approach, it's time to put it into practice.
1. Study Your Chosen Indicators:
Understand how your selected technical indicators work, including their calculation methods, interpretation, and strengths. This knowledge will help you interpret their signals accurately.
2. Analyze Price Action:
Study the price charts and identify patterns, levels, and trends that align with your chosen strategy. Make a habit of regularly observing price movements to fine-tune your skills.
3. Look for Confluence:
Identify instances where the signals from price action and your chosen indicators converge. This confluence enhances the likelihood of a successful trade setup.
4. Plan Entry and Exit:
Determine where you'll enter the trade based on the confluence of signals. Set stop-loss and take-profit levels to manage risk and secure profits. Consider using a reward-to-risk ratio to assess potential trades.
5. Monitor and Adapt:
Once in a trade, monitor its progress and be prepared to adjust your plan if market conditions change. Remember, flexibility is essential in trading.
FAQs: Answering Common Questions
Q1: Can I use multiple technical indicators at once?
A: Yes, you can combine multiple indicators to gain more comprehensive insights. However, avoid overwhelming yourself with too many indicators. Focus on a few that align well with your chosen approach.
Q2: How do I avoid false signals?
A: False signals are common in trading. Look for confirmation from multiple indicators or wait for additional price action confirmation before entering a trade. Additionally, consider using higher time frames for more reliable signals.
Q3: What's the best time frame to use?
A: The choice of time frame depends on your trading style and strategy. Short-term traders might prefer lower time frames (e.g., 5-minute or 15-minute charts), while long-term traders might focus on daily or weekly charts.
Q4: How do I manage risk?
A: Use proper risk management techniques, such as setting stop-loss orders, position sizing based on a percentage of your capital, and not risking more than you can afford to lose on a single trade.
Q5: Do these strategies work for all currency pairs?
A: While these strategies can be applied to various currency pairs, it's essential to consider the characteristics of each pair. Some strategies might work better for certain pairs due to their volatility and behavior.
Footnote:
In summary, the world of forex trading is marked by its dynamism and complexity. Combining the strengths of price action analysis and technical indicators can provide traders with a more comprehensive view of the market, leading to better-informed trading decisions. Whether you choose to rely on confluence of signals, trend confirmation, volatility and momentum, or divergence and reversals, it's essential to remember that no strategy guarantees success. Diligent risk management, continuous learning, and adaptability are crucial components of any successful trading journey. By leveraging the synergy between price action and technical indicators, traders can enhance their ability to navigate the forex market with confidence.


Discussion