
Forex trading strategies for using Heikin Ashi candles: Approaches for analyzing price trends with Heikin Ashi candles.
In the world of forex trading, where accurate analysis of price trends is crucial, traders are constantly seeking innovative tools and strategies to enhance their decision-making processes. One such tool that has gained popularity over the years is the Heikin Ashi candlestick chart. Heikin Ashi, which translates to "average bar" in Japanese, is a unique candlestick charting technique that offers an alternative perspective on price trends. In this article, we will delve into the intricacies of Heikin Ashi candles and explore various strategies for analyzing price trends using this distinctive approach.
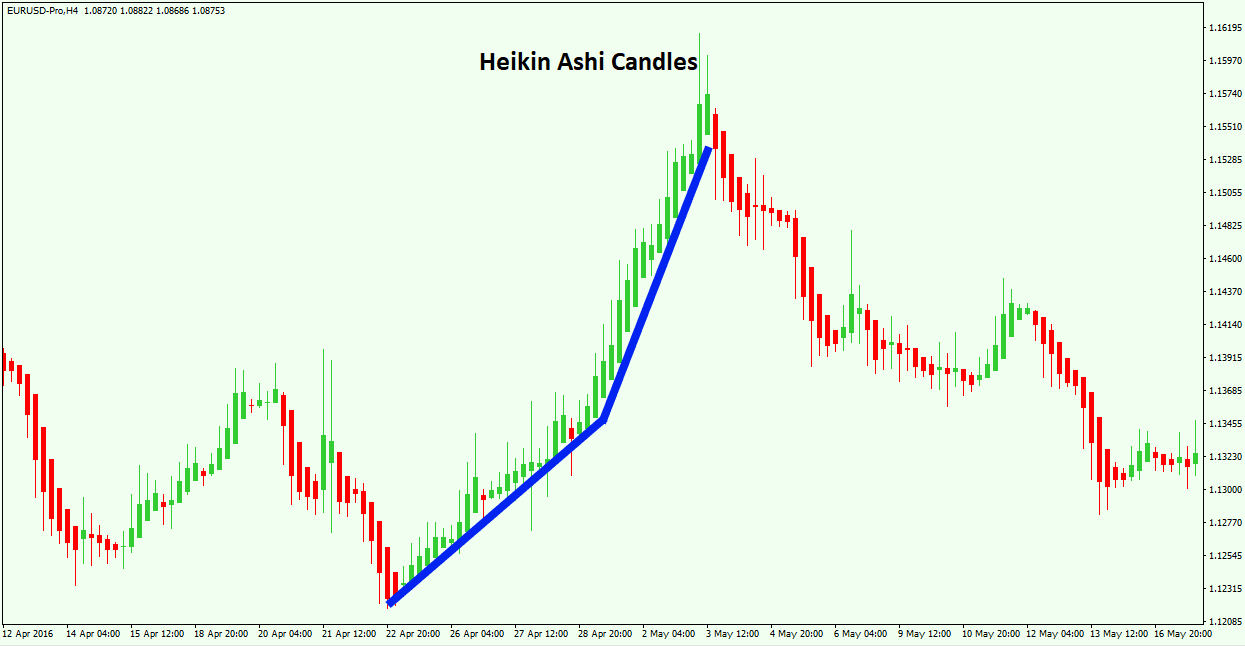
Table Content
I. Understanding Heikin Ashi Candles
II. Analyzing Price Trends with Heikin Ashi Candles
1. Trend Identification
2. Smoothing Price Movements
3. Spotting Reversal Patterns
4. Using Moving Averages
III. Trading Strategies with Heikin Ashi Candles
1. Heikin Ashi Trend-Following Strategy
2. Heikin Ashi Moving Average Crossover
3. Heikin Ashi Reversal Strategy
4. Heikin Ashi Breakout Strategy
IV. Footnote
Understanding Heikin Ashi Candles
Traditional candlestick charts display price movements using a series of open, high, low, and close prices for each period. However, Heikin Ashi charts take a different approach by considering not only the current period's price data but also the previous candle's open, close, high, and low values. This methodology results in a modified representation of price trends that can help filter out market noise and provide traders with a clearer picture of market direction.
In a Heikin Ashi candlestick, the formula for calculating the open, close, high, and low prices is as follows:
a) Heikin Ashi Close: This is the average of the open, close, high, and low prices of the current period.
b) Heikin Ashi Open: This is the average of the previous Heikin Ashi candle's open and close prices.
c) Heikin Ashi High: The highest value among the actual high, Heikin Ashi open, and Heikin Ashi close of the current period.
d) Heikin Ashi Low: The lowest value among the actual low, Heikin Ashi open, and Heikin Ashi close of the current period.
Analyzing Price Trends with Heikin Ashi Candles
1. Trend Identification:
Heikin Ashi candles are particularly useful for identifying trends and trend reversals. A series of consecutive bullish (green) Heikin Ashi candles indicates a strong uptrend, while a series of consecutive bearish (red) candles suggests a downtrend. Traders can use this visual cue to confirm trend direction and adjust their trading strategies accordingly.
2. Smoothing Price Movements:
One of the advantages of Heikin Ashi charts is their ability to smooth out price movements, making it easier to identify the overall market direction. This is especially beneficial when market volatility is high and traditional candlestick charts might present a more chaotic view of price action. Traders can use Heikin Ashi charts to filter out noise and focus on the underlying trend.
3. Spotting Reversal Patterns:
Heikin Ashi candles can also help traders identify potential trend reversals. Reversal patterns, such as double tops, double bottoms, and head and shoulders formations, are often clearer on Heikin Ashi charts due to the smoothing effect. Traders can combine these reversal patterns with other technical indicators to improve their entry and exit points.
4. Using Moving Averages:
Moving averages are widely used tools for trend analysis. When applied to Heikin Ashi charts, moving averages can provide a reliable indication of the prevailing trend. For instance, a trader might use a combination of a short-term and a long-term moving average on a Heikin Ashi chart to confirm the trend's strength and make informed trading decisions.
Trading Strategies with Heikin Ashi Candles
1. Heikin Ashi Trend-Following Strategy:
This strategy is based on riding the existing trend by using Heikin Ashi candles to confirm the direction. Traders wait for a series of consecutive bullish or bearish candles to form, indicating a strong trend. Once identified, they can enter trades in the direction of the trend. To enhance accuracy, traders might also use other technical indicators or price patterns to confirm the trend's strength.
2. Heikin Ashi Moving Average Crossover:
Incorporating moving averages into Heikin Ashi analysis can lead to a powerful strategy. When a short-term moving average crosses above a long-term moving average on a Heikin Ashi chart, it can signal a potential bullish trend reversal. Conversely, when the short-term moving average crosses below the long-term moving average, a bearish reversal might be indicated. Traders can use these crossovers as entry and exit points for their trades.
3. Heikin Ashi Reversal Strategy:
This strategy is designed to identify potential trend reversals using Heikin Ashi candles and additional technical tools. Traders look for reversal patterns such as double tops, double bottoms, or head and shoulders formations on Heikin Ashi charts. Once a reversal pattern is identified, traders can wait for confirmation from other indicators, like oscillators or trendlines, before entering a trade in the direction of the anticipated reversal.
4. Heikin Ashi Breakout Strategy:
Breakout strategies involve identifying key support and resistance levels and waiting for price to break through these levels. When using Heikin Ashi candles, traders can look for strong, consecutive candles in the direction of the breakout. This approach can help filter out false breakouts that might be more evident on traditional candlestick charts due to noise.
Footnote
Heikin Ashi candlestick charts provide traders with a unique perspective on price trends in the forex market. By incorporating the principles of averaging and smoothing, these charts offer a clearer view of trend direction, trend strength, and potential reversals. Traders can utilize Heikin Ashi candles in various strategies, such as trend-following, moving average crossovers, reversal patterns, and breakout trading, to enhance their analysis and decision-making processes.
As with any trading strategy, it's essential to practice risk management and thoroughly backtest these approaches before applying them to live trading. While Heikin Ashi candles can offer valuable insights, they should be used in conjunction with other technical and fundamental analysis tools for a comprehensive trading strategy. Ultimately, understanding the nuances of Heikin Ashi candlestick charts and integrating them into a well-rounded trading plan can help traders navigate the complexities of the forex market with greater confidence.


Discussion